

Question: You have been given the expected return data shown in the first table on three assetsF, G, and Hover the period 20162019. Using these assets,
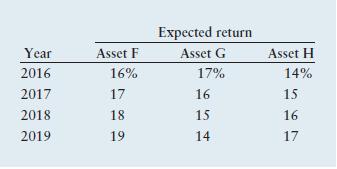
You have been given the expected return data shown in the first table on three assets—F, G, and H—over the period 2016–2019.
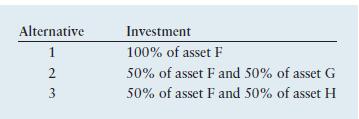
Using these assets, you have isolated the three investment alternatives shown in the following table.
a. Calculate the expected return over the 4-year period for each of the three alternatives.
b. Calculate the standard deviation of returns over the 4-year period for each of the three alternatives.
c. Use your findings in parts a and b to calculate the coefficient of variation for each of the three alternatives.
d. On the basis of your findings, which of the three investment alternatives do you recommend? Why?
Year 2016 2017 2018 2019 Asset F 16% 17 18 19 Expected return Asset G 17% 16 15 14 Asset H 14% 15 16 17
Step by Step Solution
3.39 Rating (152 Votes )
There are 3 Steps involved in it
1 Calculate the Expected Return The expected return for each asset in a specific year is given To calculate the expected return over the 4year period ... View full answer

Get step-by-step solutions from verified subject matter experts