

A commercial fisherman charts the following relationship between hours spent and the quantity of fish caught per
Question:
A commercial fisherman charts the following relationship between hours spent and the quantity of fish caught per trip.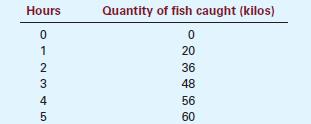
a. What is the marginal product of each hour spent fishing?
b. Using these data, graph the fisherman’s production function. Explain the shape of the production function.
c. Assume the fisherman has a fixed cost of €500 for their boat and the opportunity cost of their time is €10 per hour.
Graph the fisherman’s total cost curve and explain its shape.
Step by Step Answer:

This question has not been answered yet.
You can Ask your question!
Related Book For 

Question Posted:
