

According to 20162017 Chicago school data, the following scatterplot shows school college enrollment rate versus average American
Question:
According to 2016–2017 Chicago school data, the following scatterplot shows school college enrollment rate versus average American College Testing (ACT) test scores.
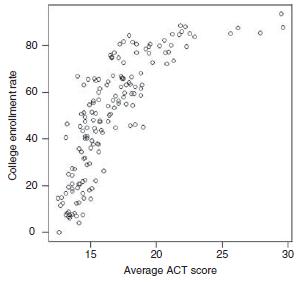
a) What happens to college enrollment rate as average ACT score increases?
b) Is there a linear association between the two variables?
Fantastic news! We've Found the answer you've been seeking!
Step by Step Answer:

Related Book For 

Principles Of Managerial Statistics And Data Science
ISBN: 9781119486411
1st Edition
Authors: Roberto Rivera
Question Posted:
