

The dot plots below show the use of energy over several ZIP Codes in the area surrounding
Question:
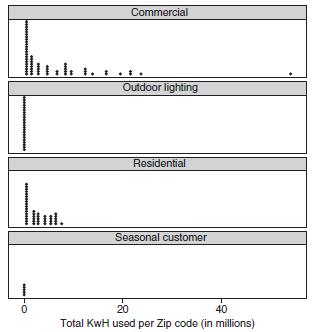
The dot plots below show the use of energy over several ZIP Codes in the area surrounding Nashville, Tennessee, in February 2017. Interpret.
Fantastic news! We've Found the answer you've been seeking!
Step by Step Answer:

Answered By
Fahmin Arakkal
Tutoring and Contributing expert question and answers to teachers and students.
Primarily oversees the Heat and Mass Transfer contents presented on websites and blogs.
Responsible for Creating, Editing, Updating all contents related Chemical Engineering in
latex language
8+ Reviews
22+ Question Solved
Related Book For 

Principles Of Managerial Statistics And Data Science
ISBN: 9781119486411
1st Edition
Authors: Roberto Rivera
Question Posted:
