

Dashboards: visual displays of multiple data set variables have become very popular because they provide decision makers
Question:
Dashboards: visual displays of multiple data set variables have become very popular because they provide decision makers a quick presentation of the overall status of a situation. The figure below is a dashboard of medical and retail gross sales of marijuana in Denver Colorado. State whether each statement is true or false.
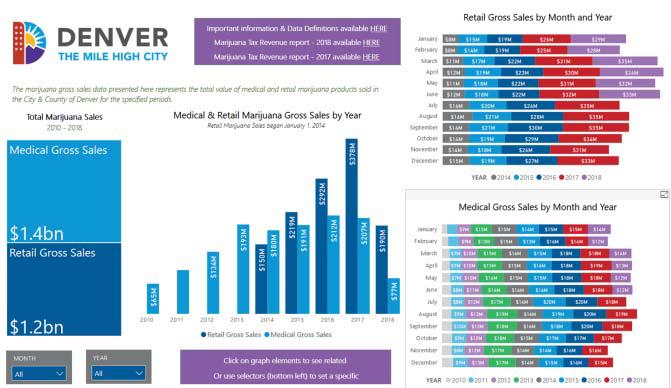
a) From 2010 to 2018, there has been $1.2 billion in retail gross sales.
b) In 2015, combined medical and retail sales exceeded $500 million.
Fantastic news! We've Found the answer you've been seeking!
Step by Step Answer:

Answered By
Mugdha Sisodiya
My self Mugdha Sisodiya from Chhattisgarh India. I have completed my Bachelors degree in 2015 and My Master in Commerce degree in 2016. I am having expertise in Management, Cost and Finance Accounts. Further I have completed my Chartered Accountant and working as a Professional.
Since 2012 I am providing home tutions.
2+ Reviews
10+ Question Solved
Related Book For 

Principles Of Managerial Statistics And Data Science
ISBN: 9781119486411
1st Edition
Authors: Roberto Rivera
Question Posted:
