

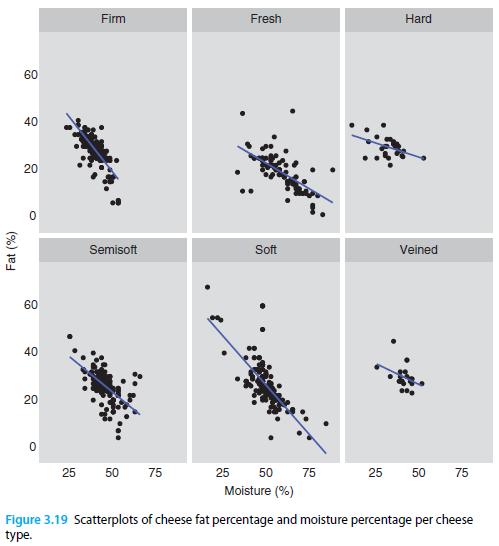
Recall that Figure 3.19 drew scatterplots of cheese fat percentage and moisture percentage using data from Canada,
Question:
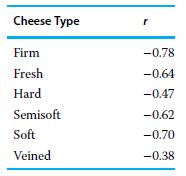
Recall that Figure 3.19 drew scatterplots of cheese fat percentage and moisture percentage using data from Canada, while also considering the type of cheese and adding a trend line. Below are the values of r by cheese type.
a) Which cheese type had the strongest linear association between fat percentage and moisture percentage?
b) Which cheese type had the weakest linear association between fat percentage and moisture percentage?
c) Does it seem like cheese type affects the linear association between fat percentage and moisture percentage?
Fantastic news! We've Found the answer you've been seeking!
Step by Step Answer:

Answered By
Felix Mucee
I am a detailed and thorough professional writer with 5 years of administrative experience- the last 2 years in academic writing and virtual office environment. I specialize in delivering quality services with respect to strict deadlines and high expectations. I am equipped with a dedicated home office complete with a computer, copier/scanner/fax and color printer.
I provide creative and detailed administrative, web search, academic writing, data entry, Personal assistant, Content writing, Translation, Academic writing, editing and proofreading services. I excel at working under tight deadlines with strict expectations. I possess the self-discipline and time management skills necessary to have served as an academic writer for the past five years. I can bring value to your business and help solve your administrative assistant issues.
13+ Reviews
33+ Question Solved
Related Book For 

Principles Of Managerial Statistics And Data Science
ISBN: 9781119486411
1st Edition
Authors: Roberto Rivera
Question Posted:
