

Refer back to Figure 7.4. What do the values in the x axis of a normal probability
Question:
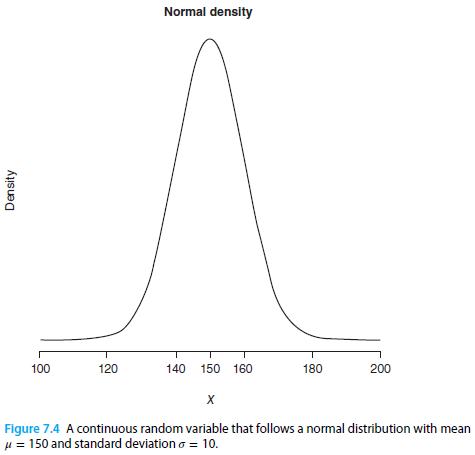
Refer back to Figure 7.4. What do the values in the x axis of a normal probability density function represent? What do the values in the y axis represent?
Fantastic news! We've Found the answer you've been seeking!
Step by Step Answer:

Answered By
Branice Buyengo Ajevi
I have been teaching for the last 5 years which has strengthened my interaction with students of different level.
1+ Reviews
10+ Question Solved
Related Book For 

Principles Of Managerial Statistics And Data Science
ISBN: 9781119486411
1st Edition
Authors: Roberto Rivera
Question Posted:
