

The table that follows presents R 2 and R 2 a (percent) values for models with between
Question:
The table that follows presents R2 and R2a (percent) values for models with between five and eight predictors.
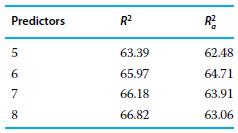
a) What are the respective R2 and R2a values for the model with 8 predictors?
b) What are the respective R2 and R2a values for the model with 5 predictors?
c) Based on the table, which model appears best? Explain.
Fantastic news! We've Found the answer you've been seeking!
Step by Step Answer:
a The respective R and Ra values for the model with 8 predictors are R 6618 Ra Adjusted R 6391 b The ...View the full answer

Answered By
User l_917591
As a Business Management graduate from Moi University, I had the opportunity to work as a tutor for undergraduate students in the same field. This experience allowed me to apply the theoretical knowledge I had gained in a practical setting, while also honing my teaching and communication skills.
As a tutor, I was responsible for conducting tutorial sessions, grading assignments and exams, and providing feedback and support to my students. I also assisted with the preparation of course materials and collaborated with other tutors and professors to ensure consistency in teaching and assessment.
0 Reviews
10+ Question Solved
Related Book For 

Principles Of Managerial Statistics And Data Science
ISBN: 9781119486411
1st Edition
Authors: Roberto Rivera
Question Posted:
