

Using Buffalo New York curb recycling data from January 2011 until June 2018, the line chart below
Question:
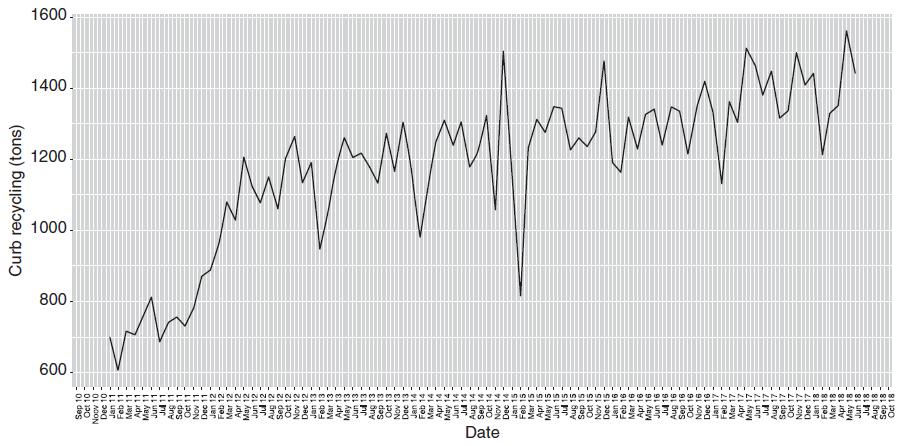
Using Buffalo New York curb recycling data from January 2011 until June 2018, the line chart below was constructed. Discuss the global trend behavior.
Fantastic news! We've Found the answer you've been seeking!
Step by Step Answer:

Answered By
Vijaya Gopal
I have got an all India rank of 3,000 in IIT JEE exam in mains. Got selected in Indian institute of technology (IIT BHUBANESWAR) . Helped so many students through various online platforms for IIT-JEE preparation. Presently working as a physics faculty in a leading institute of India for IIT-JEE preparation.
0 Reviews
10+ Question Solved
Related Book For 

Principles Of Managerial Statistics And Data Science
ISBN: 9781119486411
1st Edition
Authors: Roberto Rivera
Question Posted:
