

Using data from 55 communities in Baltimore on affordability index for mortgages (affordm15), and for rent (affordr15),
Question:
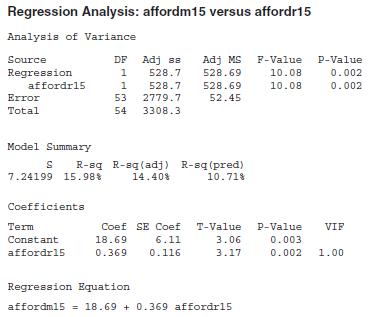
Using data from 55 communities in Baltimore on affordability index for mortgages (affordm15), and for rent (affordr15), a regression model was constructed to fit affordm15 based on affordr15. Below is the Minitab output. Any inference is performed at 1% significance.
a) Write the null and alternative to assess if there is a significant linear association between the two variables.
b) According to the F-test, is the null above rejected?
c) According to the t-test, is the null above rejected?
d) What is the estimated value of the slope?
e) Interpret the value of the coefficient of determination.
f) Estimate the coefficient of correlation.
Fantastic news! We've Found the answer you've been seeking!
Step by Step Answer:
a Null Hypothesis H0 There is no significant linear association between the variables affordm15 and ...View the full answer

Answered By
User l_917591
As a Business Management graduate from Moi University, I had the opportunity to work as a tutor for undergraduate students in the same field. This experience allowed me to apply the theoretical knowledge I had gained in a practical setting, while also honing my teaching and communication skills.
As a tutor, I was responsible for conducting tutorial sessions, grading assignments and exams, and providing feedback and support to my students. I also assisted with the preparation of course materials and collaborated with other tutors and professors to ensure consistency in teaching and assessment.
0 Reviews
10+ Question Solved
Related Book For 

Principles Of Managerial Statistics And Data Science
ISBN: 9781119486411
1st Edition
Authors: Roberto Rivera
Question Posted:
