

When frequencies of several categories of a variable are available over time, a stacked area chart can
Question:
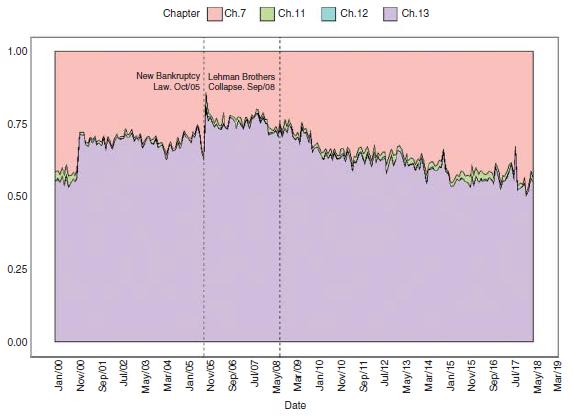
When frequencies of several categories of a variable are available over time, a stacked area chart can be constructed. The figure below illustrates the monthly behavior of different types of bankruptcies in Puerto Rico, an island in the Caribbean, from 2000 to mid 2018. The y axis shows relative frequencies and the x axis displays time.
a) Overall, what type (chapter) of bankruptcy is most common?
b) Overall, what types (chapter) of bankruptcy are the least common?
c) A new bankruptcy law to reduce the frequency of Chapter 7 bankruptcies was created in October 2005. Did the law work?
Fantastic news! We've Found the answer you've been seeking!
Step by Step Answer:

Answered By
Carly Cimino
As a tutor, my focus is to help communicate and break down difficult concepts in a way that allows students greater accessibility and comprehension to their course material. I love helping others develop a sense of personal confidence and curiosity, and I'm looking forward to the chance to interact and work with you professionally and better your academic grades.
12+ Reviews
21+ Question Solved
Related Book For 

Principles Of Managerial Statistics And Data Science
ISBN: 9781119486411
1st Edition
Authors: Roberto Rivera
Question Posted:
