Calculate the mean, median, and mode for these data. As you read in the chapter, the objective
Question:
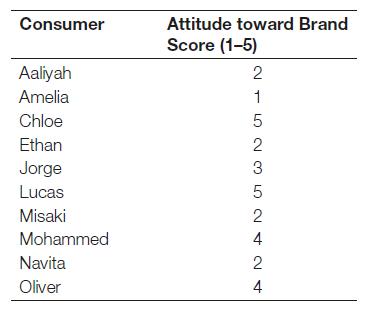
Calculate the mean, median, and mode for these data.
As you read in the chapter, the objective of descriptive research is to describe things, such as the market potential for a product or the demographics and attitudes of consumers who buy the product. Three common statistics used in descriptive research are mean, median, and mode. From these simple statistics, marketers can learn from the multitude of data available what the average value of something is, such as the average time a consumer spends on a website or the average attitude toward their brand. That is the mean, found by adding up all the values and dividing by the number of data points added together. Marketers are also interested in the middle value (that is, median) because outliers may skew a mean high or low. To find the median, marketers order the values from highest to lowest and locate the value in the middle of the dataset. Finally, mode tells the marketing researcher how often a value occurs. Creating graphs like histograms of the data are useful for visually showing the frequency of each value. Use the following consumer attitude data, collected using an attitude statement ranging from 1 = “strongly dislike” to 5 = “strongly like” concerning the brand, to calculate descriptive statistics.
Step by Step Answer:
Lets calculate the mean median and mode for the given consumer attitude score...View the full answer