

The following graph shows the supply curve and three different demand curves for a perfectly competitive industry.
Question:
The following graph shows the supply curve and three different demand curves for a perfectly competitive industry. The table represents cost data for a representative firm in the industry.
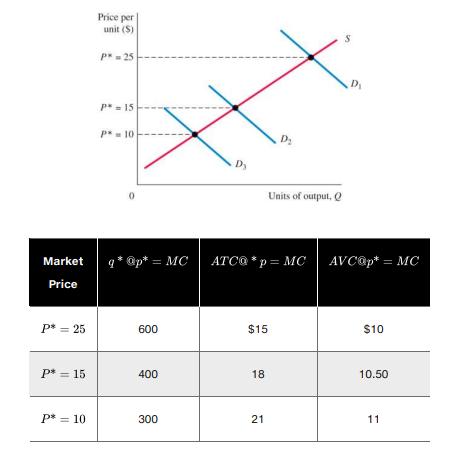
a. Use the data in the table and draw a graph for the representative firm in the industry when the industry demand curve is represented by D1. What is the profit or loss for this firm? Shade in the profit or loss area on the graph.
b. Draw a graph for the representative firm when the industry demand curve falls to D2. What is the profit or loss for this firm? Shade in the profit or loss area on the graph.
c. Draw a graph for the representative firm when the industry demand curve falls to D3. What is the profit or loss for this firm? Shade in the profit or loss area on the graph.
Step by Step Answer:

This question has not been answered yet.
You can Ask your question!


Mylab Economics With Pearson Access Code For Principles Of Microeconomics
ISBN: 9780135197141,9780135197103
13th Edition
Authors: Karl E. Case; Ray C. Fair; Sharon E. Oster
