

For the figure 57.5% at the end of Example 1.3-3 to be true, should we assume that
Question:
For the figure 57.5% at the end of Example 1.3-3 to be true, should we assume that the citizens are migrating independently?
Example 1.3-3
We revisit Example in Section 1.1. Doing simple calculations or using software, we get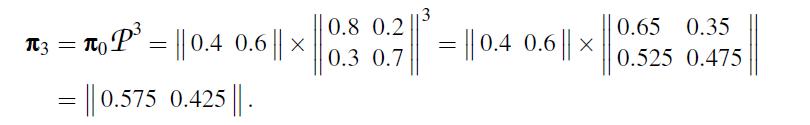
Thus, the probability that a randomly chosen citizen will live in area 0 at time t = 3 is 0.575. However, it would be a mistake to think that this means that in the third year 57.5% of people will live in area 0. The process is random, and the percentage mentioned is also random. The figure 57.5% is the expected value of the percentage of citizens of area 0 in the year mentioned. Let us show it rigorously.
Fantastic news! We've Found the answer you've been seeking!
Step by Step Answer:
No In the proof we use the fact that the expectation of ...View the full answer

Answered By
David Muchemi
I am a professional academic writer with considerable experience in writing business and economic related papers. I have been writing for my clients who reach out to me personally after being recommended to me by satisfied clients.
I have the English language prowess, no grammatical and spelling errors can be found in my work. I double-check for such mistakes before submitting my papers.
I deliver finished work within the stipulated time and without fail. I am a good researcher on any topic especially those perceived to be tough.
I am ready to work on your papers and ensure you receive the highest quality you are looking for. Please hire me to offer my readily available quality service.
Best regards,
27+ Reviews
61+ Question Solved
Related Book For 
Question Posted:
