

Question: Mutual fund performance. Many mutual funds compare their performance with that of a benchmark, an index of the returns on all securities of the kind
Mutual fund performance. Many mutual funds compare their performance with that of a benchmark, an index of the returns on all securities of the kind that the fund buys. TheVanguard International Growth Fund, for example, takes as its benchmark the Morgan Stanley Europe, Australasia, Far East (EAFE) index of overseas stock market performance. Here are the values of a $10,000 investment in the Vanguard Fund made in 1998 and the hypothetical value of a $10,000 investment in the benchmark
(EAFE):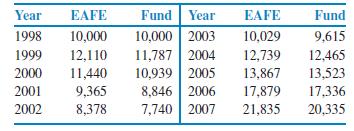
Make a scatterplot suitable for predicting fund returns fromEAFE returns. Is there a clear straight-line pattern? How strong is this pattern? (Give a numerical measure.) Are there any extreme outliers?
Year EAFE Fund Year EAFE Fund 1998 10,000 10,000 2003 10,029 9,615 1999 12,110 11,787 2004 12,739 12,465 2000 11,440 10,939 2005 13,867 13,523 2001 9,365 8,846 2006 17,879 17,336 2002 8,378 7,740 2007 21,835 20,335
Step by Step Solution
There are 3 Steps involved in it

Get step-by-step solutions from verified subject matter experts