

Question: The graphs display the data points for a linear correlation. Based on the information provided in these graphs, answer the following questions. 1. Which graph
The graphs display the data points for a linear correlation. Based on the information provided in these graphs, answer the following questions.
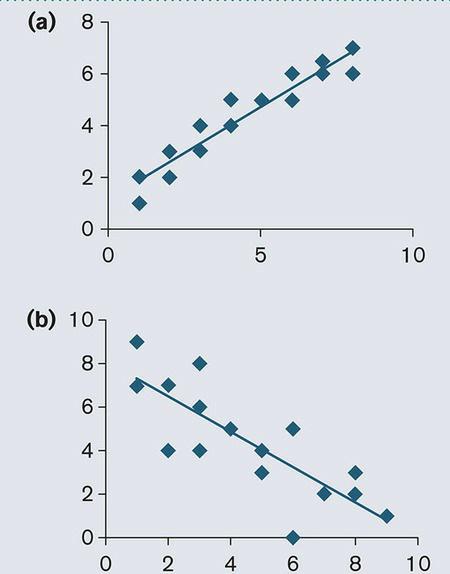
1. Which graph displays the negative correlation? Explain.
2. Which graph displays the stronger correlation? Explain.
(a) 8 6 4 2 0 0 5 10 (b) 10- 8 6- 4- 2- 0 2 4 6 8 10
Step by Step Solution
There are 3 Steps involved in it
1 Expert Approved Answer
Step: 1 Unlock

Question Has Been Solved by an Expert!
Get step-by-step solutions from verified subject matter experts
Step: 2 Unlock
Step: 3 Unlock