Question: It's an excel question that should be calculated and done in excel QUESTION 3: DIGITAL FIRST FINANCIAL Situation: Digital First Industries (DFI) is a provider
It's an excel question that should be calculated and done in excel
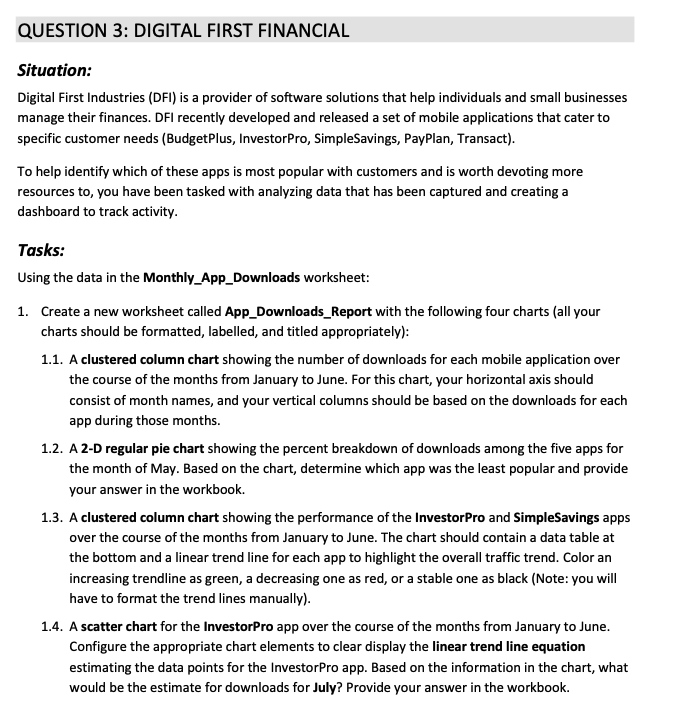
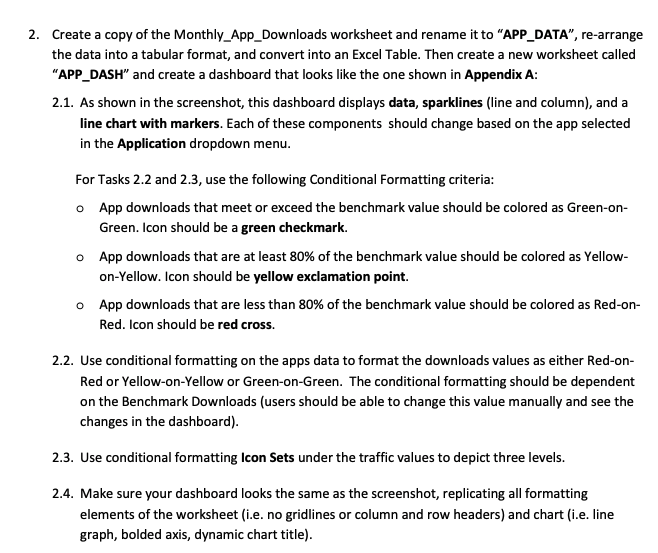
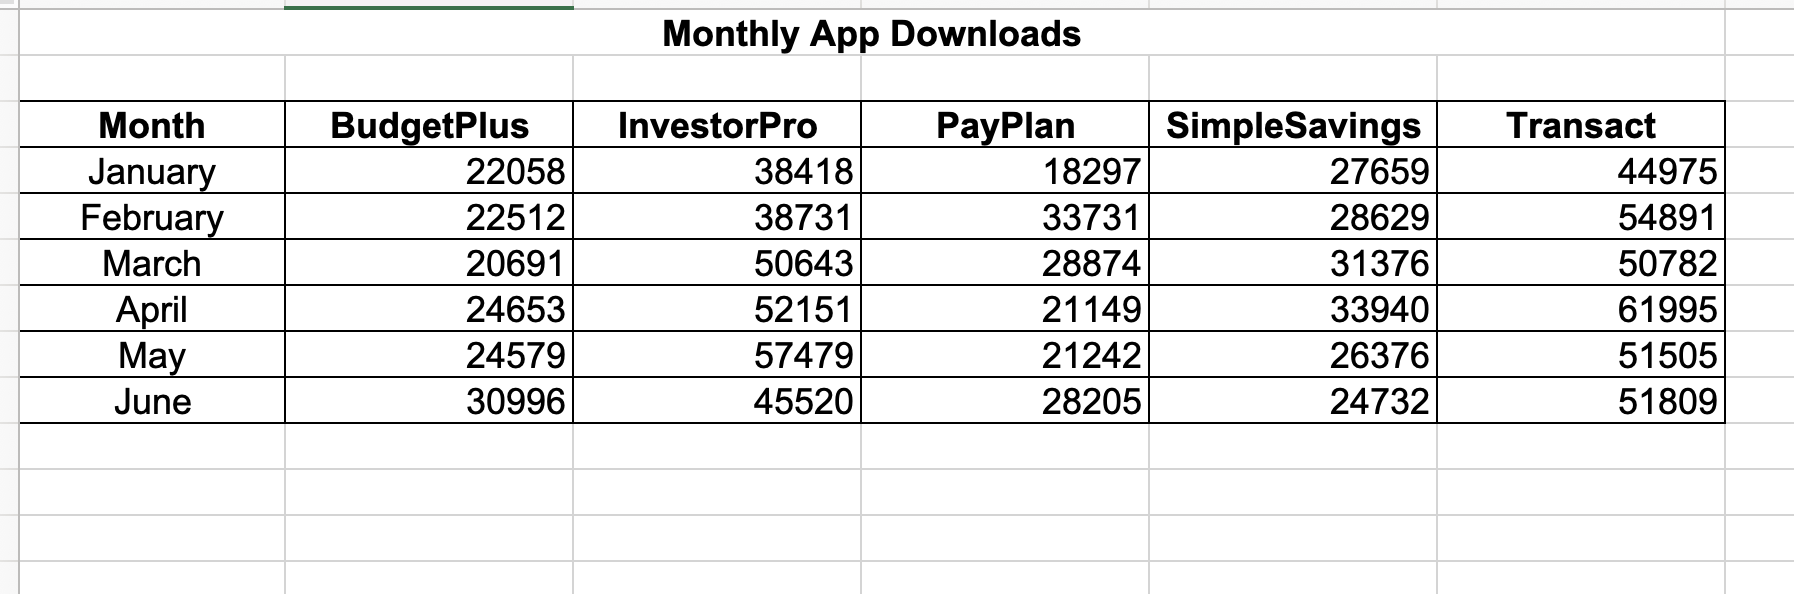
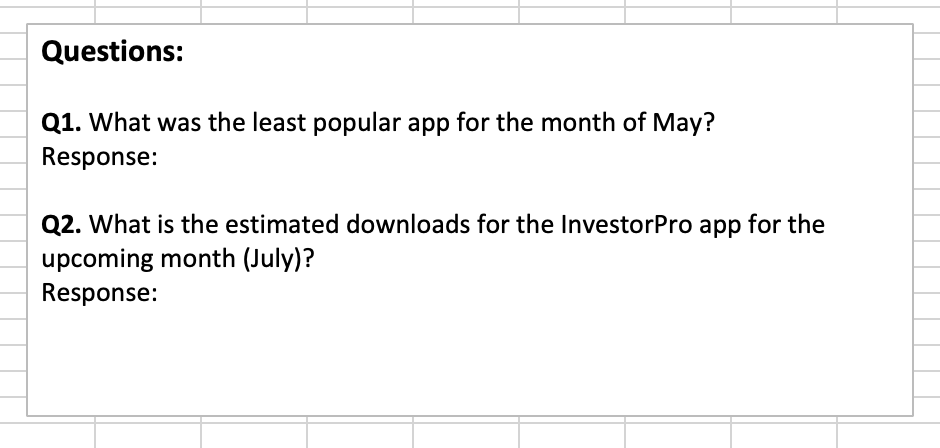

QUESTION 3: DIGITAL FIRST FINANCIAL Situation: Digital First Industries (DFI) is a provider of software solutions that help individuals and small businesses manage their finances. DFI recently developed and released a set of mobile applications that cater to specific customer needs (BudgetPlus, InvestorPro, SimpleSavings, PayPlan, Transact). To help identify which of these apps is most popular with customers and is worth devoting more resources to, you have been tasked with analyzing data that has been captured and creating a dashboard to track activity. Tasks: Using the data in the Monthly_App_Downloads worksheet: 1. Create a new worksheet called App_Downloads_Report with the following four charts (all your charts should be formatted, labelled, and titled appropriately): 1.1. A clustered column chart showing the number of downloads for each mobile application over the course of the months from January to June. For this chart, your horizontal axis should consist of month names, and your vertical columns should be based on the downloads for each app during those months. 1.2. A 2-D regular pie chart showing the percent breakdown of downloads among the five apps for the month of May. Based on the chart, determine which app was the least popular and provide your answer in the workbook. 1.3. A clustered column chart showing the performance of the Investor Pro and SimpleSavings apps over the course of the months from January to June. The chart should contain a data table at the bottom and a linear trend line for each app to highlight the overall traffic trend. Color an increasing trendline as green, a decreasing one as red, or a stable one as black (Note: you will have to format the trend lines manually). 1.4. A scatter chart for the InvestorPro app over the course of the months from January to June. Configure the appropriate chart elements to clear display the linear trend line equation estimating the data points for the InvestorPro app. Based on the information in the chart, what would be the estimate for downloads for July? Provide your answer in the workbook. 2. Create a copy of the Monthly App_Downloads worksheet and rename it to "APP_DATA, re-arrange the data into a tabular format, and convert into an Excel Table. Then create a new worksheet called "APP_DASH" and create a dashboard that looks like the one shown in Appendix A: 2.1. As shown in the screenshot, this dashboard displays data, sparklines (line and column), and a line chart with markers. Each of these components should change based on the app selected in the Application dropdown menu. For Tasks 2.2 and 2.3, use the following Conditional Formatting criteria: App downloads that meet or exceed the benchmark value should be colored as Green-on- Green. Icon should be a green checkmark. o App downloads that are at least 80% of the benchmark value should be colored as Yellow- on-Yellow. Icon should be yellow exclamation point. o App downloads that are less than 80% of the benchmark value should be colored as Red-on- Red. Icon should be red cross. 2.2. Use conditional formatting on the apps data to format the downloads values as either Red-on- Red or Yellow-on-Yellow or Green-on-Green. The conditional formatting should be dependent on the Benchmark Downloads (users should be able to change this value manually and see the changes in the dashboard). 2.3. Use conditional formatting Icon Sets under the traffic values to depict three levels. 2.4. Make sure your dashboard looks the same as the screenshot, replicating all formatting elements of the worksheet (i.e. no gridlines or column and row headers) and chart (i.e. line graph, bolded axis, dynamic chart title). Monthly App Downloads Month January February March April May June BudgetPlus 22058 22512 20691 24653 24579 30996 InvestorPro 38418 38731 50643 52151 57479 45520 PayPlan 18297 33731 28874 21149 21242 28205 Simple Savings 27659 28629 31376 33940 26376 24732 Transact 44975 54891 50782 61995 51505 51809 Questions: Q1. What was the least popular app for the month of May? Response: Q2. What is the estimated downloads for the InvestorPro app for the upcoming month (July)? Response: Appendix A - Dashboard Screenshot Benchmark 25000 Application January February March PayPlan 18297 33731 28874 BudgetPlus Budget Plus InvestorPro Simple Savings PayPlan Transact April 21149 May 21242 June 28205 Trend Downloads for PayPlan 33731 28874 28205 21149 21242 18297 January February March April May June


