

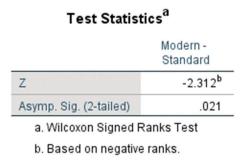
Question: The image below shows the SPSS output table for a Wilcoxon signed-ranks T test for the time (in minutes per hour) spent on task among
The image below shows the SPSS output table for a Wilcoxon signed-ranks T test for the time (in minutes per hour) spent on task among 10 students in a standard classroom
(times: 45, 46, 48, 41, 34, 38, 42, 40, 38, 44) and in a modern classroom (corresponding times: 45, 54, 55, 48, 40, 56, 38, 42, 55, 47). This is the same example and data as given in Learning Check 18.3 for the related-samples sign test. [Please feel free to enter these data in SPSS and follow the directions given in Section 18.5 to reproduce the SPSS output table shown.] Based on the data summarized in the table, which of the following statements are true?
a. The decision for this test is to fail to reject the null hypothesis, p = .021.
b. The decision for this test is to reject the null hypothesis, p = .021.
c. The normal approximation for the Wilcoxon signed-ranks T test is given for the test statistic in the SPSS output table.
d. Both b and c are true.
Z Test Statistics Asymp. Sig. (2-tailed) Modern- Standard -2.312b a. Wilcoxon Signed Ranks Test b. Based on negative ranks. .021
Step by Step Solution
There are 3 Steps involved in it

Get step-by-step solutions from verified subject matter experts