

Question: The image below shows the SPSS output table for a related-samples sign test for the time (in minutes per hour) spent on task among 10
The image below shows the SPSS output table for a related-samples sign test for the time
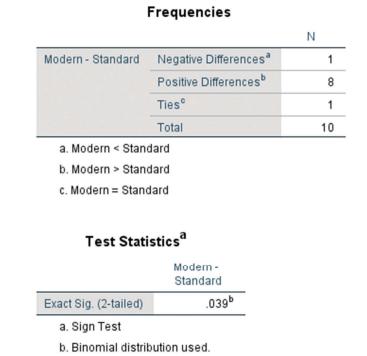
(in minutes per hour) spent on task among 10 students in a standard classroom (times:
45, 46, 48, 41, 34, 38, 42, 40, 38, 44) and in a modern classroom (corresponding times: 45, 54, 55, 48, 40, 56, 38, 42, 55, 47). [Please feel free to enter these data in SPSS and follow the directions given in Section 18.3 to reproduce the SPSS output table shown.] Based on the data summarized in the table, which of the following statements is true?
a. The decision for this test is to fail to reject the null hypothesis, p = .039.
b. The decision for this test is to reject the null hypothesis, p = .039.
c. The value of the test statistic is x = 10.
Frequencies Modern-Standard Negative Differences* Positive Differences N Ties Total a. Modern < Standard b. Modern > Standard c. Modern Standard Test Statistics Modem- Standard Exact Sig. (2-tailed) .039b a. Sign Test b. Binomial distribution used. 1 8 1 10
Step by Step Solution
There are 3 Steps involved in it

Get step-by-step solutions from verified subject matter experts