

Question: As a specific biological example for Exercise 24.2 and Fig. E24.2(b), the synthesis of tryptophan can be described by the following set of material balances:
As a specific biological example for Exercise 24.2 and Fig. E24.2(b),ˆ— the synthesis of tryptophan can be described by the following set of material balances:![IOR) = k,[0,]C,[T] – kj[OR] – H[Og] dt IMRNA] = k,[OR]C_[T] – k„[MRNA] – µ[MRNA] dt [E] = k½[MRNA] – µ[E]](https://dsd5zvtm8ll6.cloudfront.net/si.question.images/images/question_images/1534/3/3/2/1695b740d093d11a1534314442349.jpg)
where k1, k2, k3, and k4 represent kinetic rate constants for the synthesis of free operator, mRNA transcription, translation, and tryptophan synthesis, respectively. Parameters O t, μ, kd1, and kd2 refer to total operator site concentration, specific growth rate of E. coli, degradation rate constants of free operator OR, and mRNA, respectively. E and T represent concentrations of enzyme anthranilate synthase and tryptophan, respectively, in the cell. Kg and g are the half saturation constant and kinetic constant for the uptake of
tryptophan for protein synthesis in the cell. Model parameter values are as follows: k1 = 50 min-1; k2 = 15 min-1; k3 = 90 min-1; k4 = 59 min-1; Ot = 3.32 nM; kd1 = 0.5 min-1; k d2 = 15 min-1; μ = 0.01 min-1; g = 25 μM ‹… min-1; Kg = 0.2 μM. Here, controllers C1(T), C2(T), and C3(T) represent repression, attenuation, and inhibition, respectively, by tryptophan and are modeled by a particular form of Michaelis€“Menten kinetics (the Hill equation) as follows:
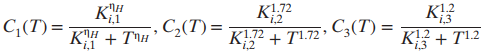
Ki ,1, Ki,2, and Ki,3 represent the half-saturation constants, with values Ki,1 = 3.53 μM; Ki,2 = 0.04 μM; Ki,3 = 810 μM, whereas sensitivity of genetic regulation to tryptophan concentration, ηH = 1.92.
(a) Draw a block diagram, using one block for each of the four states. Comment on the similarities between this diagram and schematic (b) in Fig. E24.2.
(b) Simulate the response of the system to a step change in the concentration of the medium (change g from 25 to 0 μM).
(c) Calculate the rise time, overshoot, decay ratio, and settling time for the closed-loop response.
(d) Omit the inner two feedback loops (by setting C2 and C3 to 0) and change the following rate constants: Ki,1 = 8 × 10⁻⁸ μM; ηH = 0.5. Repeat the simulation described in part (b), and obtain the new closed-loop properties for this network (compared to part (c)).
![IOR) = k,[0,]C,[T] kj[OR] H[Og] dt IMRNA] = k,[OR]C_[T] k[MRNA] [MRNA] dt](https://dsd5zvtm8ll6.cloudfront.net/si.question.images/images/question_images/1534/3/3/2/6725b740f001f7fd1534314945230.jpg)
IOR) = k,[0,]C,[T] kj[OR] H[Og] dt IMRNA] = k,[OR]C_[T] k[MRNA] [MRNA] dt [E] = k[MRNA] [E] dt [T] [T] + Kg [T] = KC3[T][E] 8; - 1 dt K} 72 1,2 |C,(T) = C3(T) = K + T12 i,1 KH + TH C,(T)= i,3 K? + T1.72 ' ri,2 i,1 i,3
Step by Step Solution
3.55 Rating (165 Votes )
There are 3 Steps involved in it
a In this figure four states synthesis of free operator mRNA transcription translation ... View full answer

Get step-by-step solutions from verified subject matter experts