

Question: 7.1. For the project below, the activities, nodes, and manpower are shown. a. Draw PERT chart with earliest and latest start and finish times. Fill
7.1. For the project below, the activities, nodes, and manpower are shown. 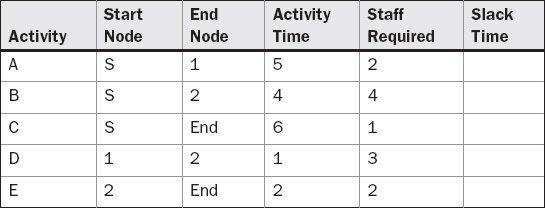
a. Draw PERT chart with earliest and latest start and finish times. Fill in the slack time of all activities and show the critical path.b. For the project duration, show the staffing profile in people, beginning at the earliest time (forward pass).
c. For the project duration, show the staffing profile in people, beginning at the latest time (backward pass).
d. If crashing any one activity by one week is equal to $1000, which one activity is best to crash and for how many weeks to shorten total project time? Show the results in the manpower diagram, and all critical paths after you crash one activity. Show new critical path(s) if any and new PERT chart after crashing.
Start End Activity Staff Slack Activity Node Node Time Required Time A B C S S S 1 5 2 2 4 4 End 6 1 D 1 2 1 3 E 2 End 2 2
Step by Step Solution
There are 3 Steps involved in it

Get step-by-step solutions from verified subject matter experts