

Question: 8. Determine the central lines and control limits for Z and W charts with a subgroup size of 2 and draw the graphs. If the
8. Determine the central lines and control limits for Z and W charts with a subgroup size of 2 and draw the graphs. If the target X is 1.50 and the target R is 0.08, determine the plotted points for three subgroups.
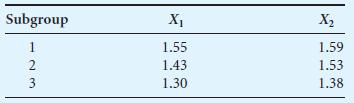
Subgroup X X 123 1.55 1.59 1.43 1.53 3 1.30 1.38
Step by Step Solution
There are 3 Steps involved in it
1 Expert Approved Answer
Step: 1 Unlock

Question Has Been Solved by an Expert!
Get step-by-step solutions from verified subject matter experts
Step: 2 Unlock
Step: 3 Unlock