

In Figure 20-35, the relative detection limit is 37 after 1 s of signal averaging, 12.5 after
Question:
In Figure 20-35, the relative detection limit is 37 after 1 s of signal averaging, 12.5 after 10 s, and 5.6 after 40 s of signal averaging. Based on the value of 37 at 1 s, what are the expected detection limits at 10 s and 40 s in an ideal experiment?
In Figure 20-35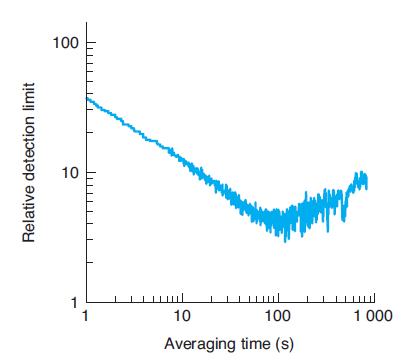
Fantastic news! We've Found the answer you've been seeking!
Step by Step Answer:
Answer Based on the given information we can assume that the relative detection limit is ...View the full answer

Answered By
Muhammad Mujtaba
I have done Btech in civil from I k Gujral Punjab technical university with 8.15 cgpa out of 10.i have a vast knowledge about civil engineering i am able to solve numerical with high precision. I've had a good teaching experience. Tutoring is something that I enjoy and find it rewarding.
0 Reviews
10+ Question Solved
Related Book For 
Question Posted:
