Synthetic data are given below for a calibration curve in which random Gaussian noise with a standard
Question:
Synthetic data are given below for a calibration curve in which random Gaussian noise with a standard deviation of 80 was superimposed on y values for the equation y = 26.4 x 1 1.37. This exercise shows that a high value of R2 does not guarantee that data quality is excellent.
(a) Enter concentration in column A and signal in column B of a spreadsheet. Prepare an XY Scatter chart of signal versus concentration without a line as described in Section 2-11. Use LINEST (Section 4-7) to fi nd the least-squares parameters including R2.
(b) Now insert the Trendline by following instructions on page 88. In the Options window used to select the Trendline, select Display Equation and Display R-Squared. Verify that Trendline and LINEST give identical results.
(c) Add 95% confidence interval y error bars following the instructions at the end of Section 4-9. The 95% confidence interval is ± tsy, where sy comes from LINEST and Student’s t comes from Table 4-4 for 95% confidence and 11 2 2 5 9 degrees of freedom. Also, compute t with the statement “5TINV(0.05,9)”.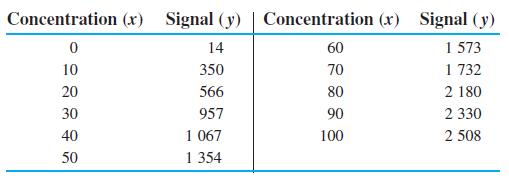
Step by Step Answer: