

Calibration curve. Figure 21-30 describes graphite furnace atomic absorbance determination of silver within individual Daphnia magna. Calibration
Question:
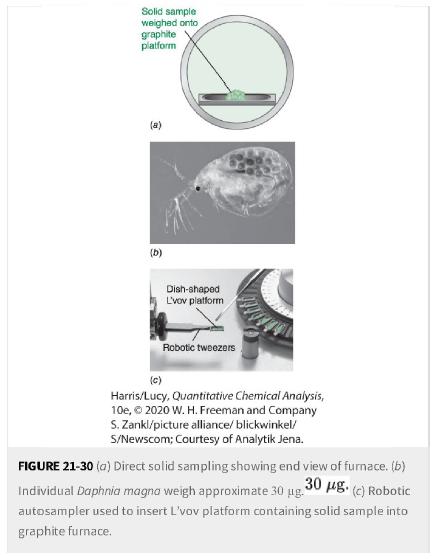
Calibration curve. Figure 21-30 describes graphite furnace atomic absorbance determination of silver within individual Daphnia magna. Calibration data at 328.068 nn 328.068 nn is shown below.
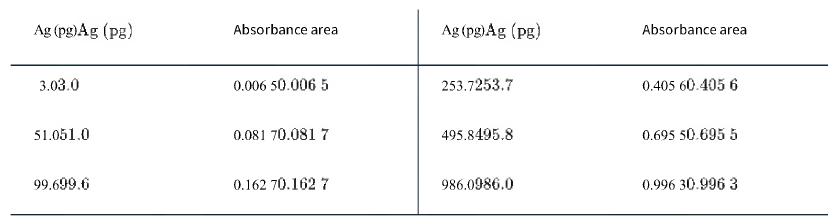
a. Construct a calibration plot. Is the calibration linear?
b. Fitting data to a quadratic function yields y=-8.079x10-7x2+1.812x10⁻³ x-0.004 8 y =-8.079 x 10-7x2 + 1.812 x10⁻³ x - 0.0048 with negligible residuals and R2=0.999 9.R2 = 0.999 9. An unknown sample yields a peak area of 0.598 2. 0.5982. How much AgAg is in the unknown?
Figure 21-30
Fantastic news! We've Found the answer you've been seeking!
Step by Step Answer:
Answer a The calibration plot would be a graph of peak ...View the full answer

Answered By
Justin Akengo
I am writing in application for the tutor position with your organisation. I am experienced in tutoring students of all abilities and I believe I am the ideal candidate for this position.
I work with students of all ages, from elementary school to college level. Whether the subject is science, Mathematics or basic study skills, I break material down into easy-to-understand concepts. In your job posting, you asked for someone who can tutor in a variety of subjects. I am comfortable explaining calculus to a college student or working with a kindergartener on spelling fundamentals.
Below are just a few core skills and qualifications I posses as a tutor;
Adept at creating study materials in a variety of academic subjects to help students improve their test scores and GPAs.
Strong interpersonal skills in working with students to help them achieve and succeed.
Have written study books adopted by a high school and a college to help students improve their skills in English and mathematics.
Have won several “Tutor of the Year” awards for work with high school and college students.
0 Reviews
10+ Question Solved
Related Book For 
Quantitative Chemical Analysis
ISBN: 9781319164300
10th Edition
Authors: Daniel C. Harris, Charles A. Lucy
Question Posted:
