

Question: Consider the linear calibration curve in Figure 4-13, which is derived from the 14 corrected absorbances in the shaded region at the right side of
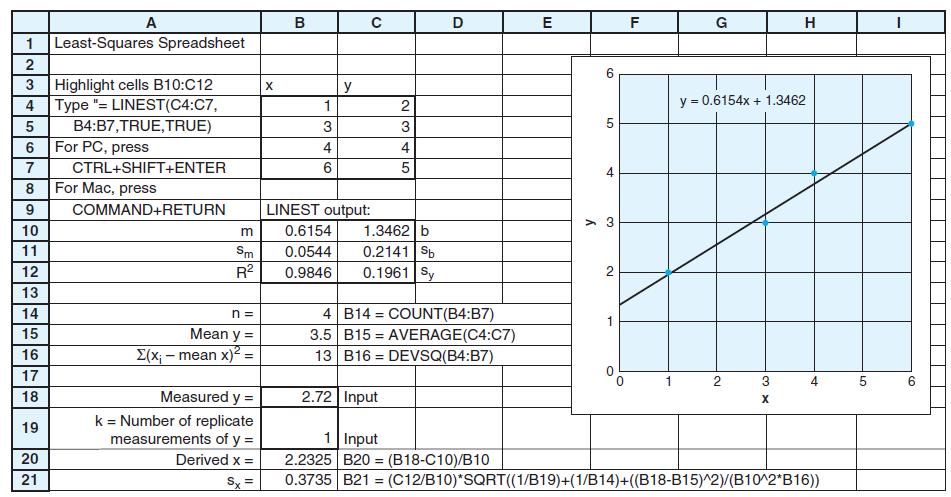
Consider the linear calibration curve in Figure 4-13, which is derived from the 14 corrected absorbances in the shaded region at the right side of Table 4-7. Create a least-squares spreadsheet like Figure 4-15 to compute the equation of the line and the standard deviations of the parameters. Suppose that you find absorbance values of 0.265, 0.269, 0.272, and 0.258 for four identical samples of unknown and absorbances of 0.099, 0.091, 0.101, and 0.097 for four blanks. Find the corrected absorbance by subtracting the average blank from the average absorbance of the unknown. Calculate the amount of protein and its uncertainty in the unknown.
Figure 4-13
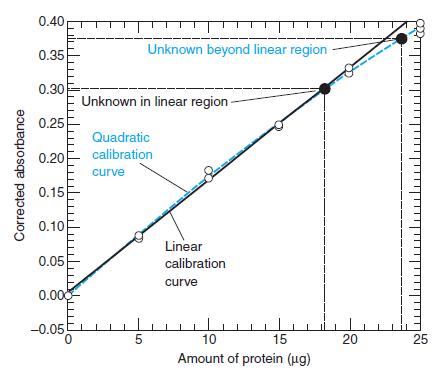
Figure 4-15
0.40 Unknown beyond linear region 0.35 0.30 Unknown in linear region 0.25 Quadratic calibration 0.20 curve 0.15 0.10 Linear 0.05 calibration curve 0.000 -0.05 5 10 15 20 25 Amount of protein (ug) Corrected absorbance
Step by Step Solution
3.39 Rating (177 Votes )
There are 3 Steps involved in it
To create a leastsquares spreadsheet we first need to calculate the values of x an... View full answer

Get step-by-step solutions from verified subject matter experts