

Question: Excel LINEST function. Enter the following data in a spreadsheet and use LINEST to find slope, intercept, and standard deviations. Use Excel to draw a
Excel LINEST function. Enter the following data in a spreadsheet and use LINEST to find slope, intercept, and standard deviations. Use Excel to draw a graph of the data and add a trendline. Draw error bars of ± sy on the points.
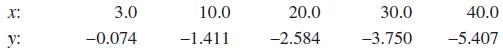
X: 3.0 10.0 20.0 30.0 40.0 y: -0.074 -1.411 -2.584 -3.750 -5.407
Step by Step Solution
★★★★★
3.40 Rating (162 Votes )
There are 3 Steps involved in it
1 Expert Approved Answer
Step: 1 Unlock

Question Has Been Solved by an Expert!
Get step-by-step solutions from verified subject matter experts
Step: 2 Unlock
Step: 3 Unlock