

Figure 20-36 shows standard uncertainty for measurements of carbon monoxide using averaging times of 11 to 1
Question:
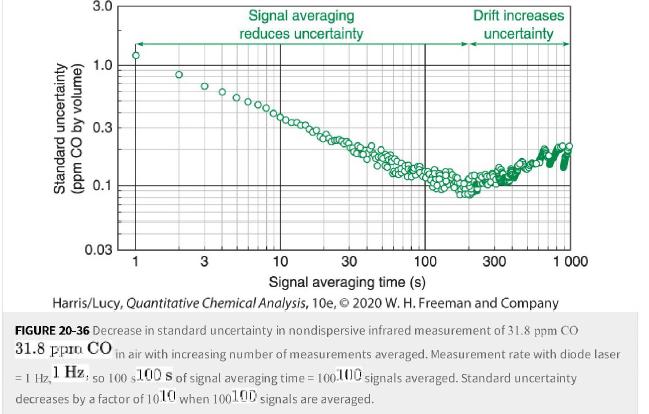
Figure 20-36 shows standard uncertainty for measurements of carbon monoxide using averaging times of 11 to 1 000 s. 1000 s.
a. Figure 20-36 is a log-log plot. Read the standard uncertainty for 44 and 1616 s of signal averaging off the graph.
b. Based on a value of 1.18 ppm 1.18 ppm for 1 s 1s of signal averaging, what are the expected standard uncertainties at 4 4 and 16 s 16s in an ideal experiment?
c. What standard uncertainty is predicted if signal is averaged for 100 s 100 s ? Does this agree with the experimental results in Figure 20-36?
d. Why does standard uncertainty increase when averaging for 200200 or more seconds?
Figure 20-36
Fantastic news! We've Found the answer you've been seeking!
Step by Step Answer:
Answer a The standard uncertainty for 44 and 1616 s of signal averaging can be read off the ...View the full answer

Answered By
Labindao Antoque
I graduated in 2018 with a Bachelor of Science degree in Psychology from Dalubhasaan ng Lungsod ng San Pablo. I tutored students in classes and out of classes. I use a variety of strategies to tutor students that include: lecture, discussions about the subject matter, problem solving examples using the principles of the subject matter being discussed in class , homework assignments that are directed towards reinforcing what we learn in class , and detailed practice problems help students to master a concept. I also do thorough research on Internet resources or textbooks so that I know what students need to learn in order to master what is being taught in class .
0 Reviews
10+ Question Solved
Related Book For 

Quantitative Chemical Analysis
ISBN: 9781319164300
10th Edition
Authors: Daniel C. Harris, Charles A. Lucy
Question Posted:
