

Stern-Volmer plot. The table shows intensity and lifetime data for luminescence of the ruthenium complex in Figure
Question:
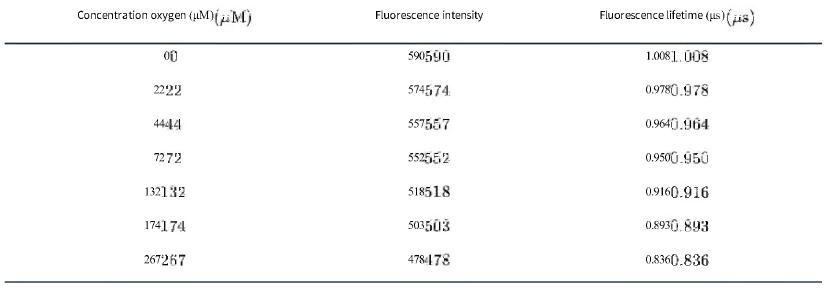
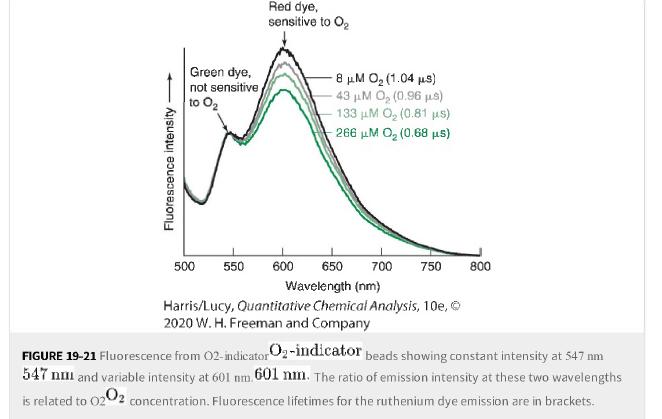
Stern-Volmer plot. The table shows intensity and lifetime data for luminescence of the ruthenium complex in Figure 19-21 for a range of oxygen concentrations.
a. Why does the luminescence intensity decrease as the oxygen concentration increases?
b. Plot a Stern-Volmer graph based on fluorescence intensity. Is the calibration linear?
c. Plot a Stern-Volmer graph based on fluorescence lifetime. What type of quenching is indicated by the plot?
Figure 19-21
Fantastic news! We've Found the answer you've been seeking!
Step by Step Answer:
Answer a As oxygen concentration increases the luminescence intensity decreases because ...View the full answer

Answered By
Justin Akengo
I am writing in application for the tutor position with your organisation. I am experienced in tutoring students of all abilities and I believe I am the ideal candidate for this position.
I work with students of all ages, from elementary school to college level. Whether the subject is science, Mathematics or basic study skills, I break material down into easy-to-understand concepts. In your job posting, you asked for someone who can tutor in a variety of subjects. I am comfortable explaining calculus to a college student or working with a kindergartener on spelling fundamentals.
Below are just a few core skills and qualifications I posses as a tutor;
Adept at creating study materials in a variety of academic subjects to help students improve their test scores and GPAs.
Strong interpersonal skills in working with students to help them achieve and succeed.
Have written study books adopted by a high school and a college to help students improve their skills in English and mathematics.
Have won several “Tutor of the Year” awards for work with high school and college students.
0 Reviews
10+ Question Solved
Related Book For 
Quantitative Chemical Analysis
ISBN: 9781319164300
10th Edition
Authors: Daniel C. Harris, Charles A. Lucy
Question Posted:
