

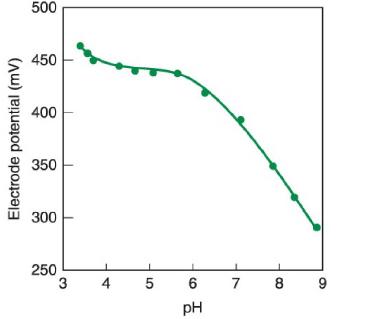
The figure shows the effect of pHpH on the response of a nitrite (NO2-) (NO - 2
Question:
The figure shows the effect of pHpH on the response of a nitrite (NO2-) (NO-2) ion-selective electrode immersed in 1 μM NaNO2+1 mM NaCLl. 1 μM NaNO2+1 mM NaCLl. The authors recommend using the flat region near pH5.5pH5.5 for measuring nitrite. To a first approximation, we expect the electrode to respond to [NO2-][NO-2] by the equation E=constant-(59 mV) log [NO2-].E = constant - (59 mV) log [NO-2].
a. Look up pKapKa for nitrous acid and explain the behavior of the curve at pH<4.pH < 4.
b. Suggest an explanation for the behavior at pH>6.pH > 6.
Fantastic news! We've Found the answer you've been seeking!
Step by Step Answer:
a The pKa for nitrous acid is approximately 33 At pH values lower than the pKa the nitrous acid HNO2 ...View the full answer

Answered By
FELIX NYAMBWOGI
I have been tutoring for over 5 years, both in person and online. I have experience tutoring a wide range of subjects, including math, science, English, and history. I have also worked with students of all ages, from elementary school to high school.
In addition, I have received training in effective tutoring strategies and techniques, such as active listening, questioning, and feedback. I am also proficient in using online tutoring platforms, such as Zoom and Google Classroom, to effectively deliver virtual lessons.
Overall, my hands-on experience and proficiency as a tutor has allowed me to effectively support and guide students in achieving their academic goals.
0 Reviews
10+ Question Solved
Related Book For 

Quantitative Chemical Analysis
ISBN: 9781319164300
10th Edition
Authors: Daniel C. Harris, Charles A. Lucy
Question Posted:
