

Question: 1. Choose a Key Performance Indicator (KPI), such as those examples listed in Table 1.3, for an actual company. 2. Create a time series based
1. Choose a Key Performance Indicator (KPI), such as those examples listed in Table 1.3, for an actual company.
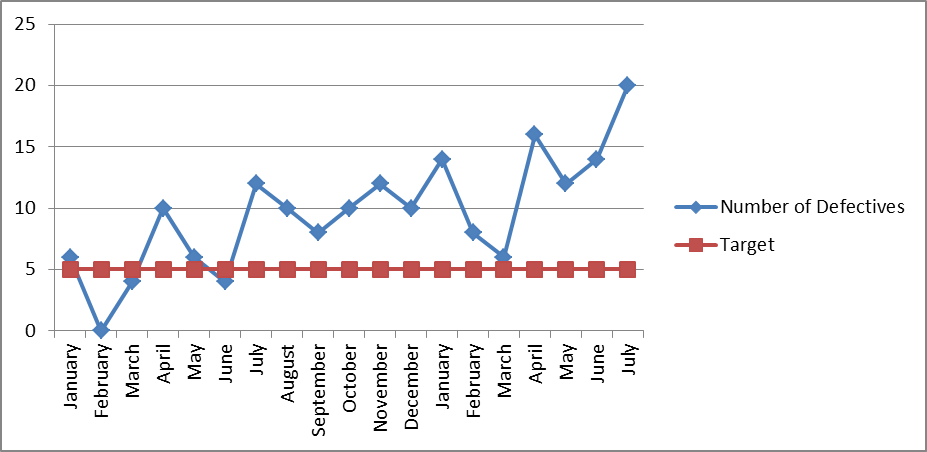
2. Create a time series based KPI chart that consists of at least six actual data points that have been accumulated over a period of time. These actual data points are typically compared to a target value. Deviations from target indicate poor performance and opportunity for improvement. Please create this KPI chart in Microsoft Excel. In Excel, time series charts are called ?line charts.? There are many YouTube videos which will show you how to create a line chart using your particular version of Excel. An example is as follows:
3. What conclusions can be drawn from the KPI chart?
January February March April May June July August September October November December January February March April May June July 10 Target -Number of Defectives 15 20 25
Step by Step Solution
3.51 Rating (154 Votes )
There are 3 Steps involved in it
Key Performance Indicator KPI Selection KPI For this example lets choose Number of Defectives for a ... View full answer

Get step-by-step solutions from verified subject matter experts