

Question: a) Use Excel to create a scatter plot of the data. b) Predict the savings for someone who earns $50,000 annually. c) If a person?s
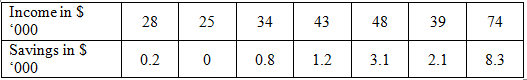
a) Use Excel to create a scatter plot of the data.
b) Predict the savings for someone who earns $50,000 annually.
c) If a person?s income increased by $5000, how much of an increase in savings would be predicted?
Table below is gathered data obtained from a random sample of 1000 students. Table shows Gender and Residence of Students
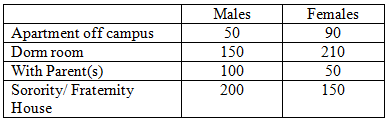
a) What is the probability that a student is female and lives in a dorm?
b) What is the probability that a student is female given that she lives in a dorm?
c) What is the probability that a student lives in a dorm given that she is a female?
d) What is the probability that a student lives in a dorm or an apartment off campus?
e) What are the odds in favor of choosing a student who lives in a dorm?
Income in $ *000 Savings in S *000 28 0.2 25 0 34 0.8 43 1.2 48 3.1 39 2.1 74 8.3 Apartment off campus Dorm room With Parent(s) Sorority/Fraternity House Males 50 150 100 200 Females 90 210 50 150
Step by Step Solution
3.50 Rating (147 Votes )
There are 3 Steps involved in it
Part 1 Scatter Plot and Predictions a Scatter Plot To create a scatter plot in Excel 1 Open Excel an... View full answer

Get step-by-step solutions from verified subject matter experts