

A group of legislators wanted to look at factors that affect the number of traffic fatalities. They
Question:
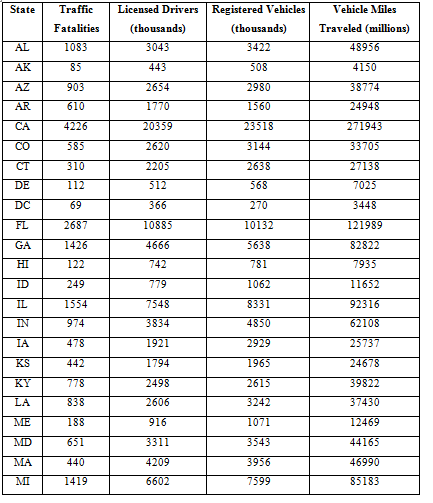
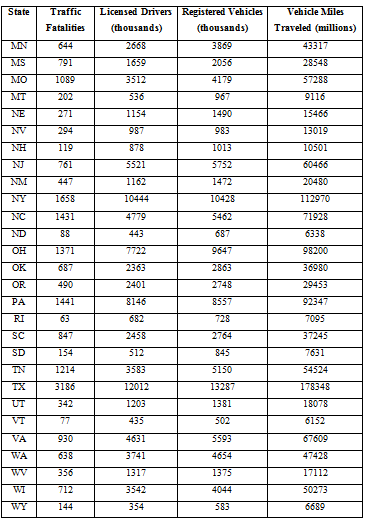
A group of legislators wanted to look at factors that affect the number of traffic fatalities. They collected some data for 1994 from the National Transportation Safety Board on the number of fatalities for 50 states and the District of Columbia (DC), the number of licensed drivers, the number of registered vehicles, and the number of vehicle miles traveled.
(a) Copy and paste the data from this document to an Excel file. Select the Number of Traffic Fatalities as the dependent variable. Do a scatter plot between the Number of Traffic Fatalities and Number of licensed drivers (in thousands), a second scatter plot between the Number of Traffic Fatalities and the Number of Registered Vehicles (in thousands) and a third scatter plot between the Number of Traffic Fatalities and the Number of Vehicle Miles Traveled (in millions). Paste the scatter plots below and discuss the nature of the relationship based on the scatter plots. Note: Follow the instructions given in module 4 to do the scatter plots.
(b) Select the Number of Traffic Fatalities as the dependent variable and the Number of licensed drivers (in thousands), the Number of Registered Vehicles (in thousands) and the Number of Vehicle Miles Traveled (in millions) as independent variables. Conduct multiple regressions using Excel. Paste the output report below. Note: Follow the instructions given in module 4 to conduct simple regression. At the step where you specify the input data range, instead of selecting the data for one independent variable, select data for all the independent variables.
(c) Writethe equation from the regression output report. If you are using symbols in the equation for the variables, do define the symbols before using the symbols in the equation. Provide clear and complete interpretation of the coefficients b1, b2 and b3 in the equation. There is no need to interpret b0.
(d) What is the value of R2 for this model? Do you think that the model does a good job of explaining the variation in the number of traffic fatalities? Why or why not?
(e) Set up the hypotheses to test whether the model is significant. Is the regression model significant at 0.05 as the level of significance? What does this mean?
(f) Set up the hypotheses to test for each of the regression coefficients individually and perform the test at the 0.05 level of significance.
(g) What are your conclusions from the tests on individual coefficients? Do any variables need to be dropped? If so, rerun the regression and determine the final regression equation. Note: drop the variables one at a time starting with the variable with the largest p-value (least significant), rerun the regression without the data for the dropped variable, check the p-values again and continue the process until all p-values (other than for the intercept term) are less than the level of significance.
(h) Compare the final equation with the first regression equation. What recommendations do you have about using the final equation? Give reasons for your answer.
(i) Suppose there was a state with the following values of the independent variables: Number of Licensed Drivers (in thousands) = 3,500, Number of Registered Vehicles (in thousands) = 4,000 and Number of Vehicle Miles Traveled (in millions) = 45,000. Determine and interpret the predicted value of the number of traffic fatalities.
Expert Answer:
a We can note that there is positive correlation between Traffic Fatalities and the three explanatory variables SUMMARY OUTPUT Regression Statistics Multiple R 0982548538 R Square 096540163 Adjusted R ... View the full answer


Using Financial Accounting Information The Alternative to Debits and Credits
ISBN: 978-1133161646
7th Edition
Authors: Gary A. Porter, Curtis L. Norton
