

Exercises contain graphs portraying the decision criterion for a one-mean z-test. The curve in each graph is
Fantastic news! We've Found the answer you've been seeking!
Question:
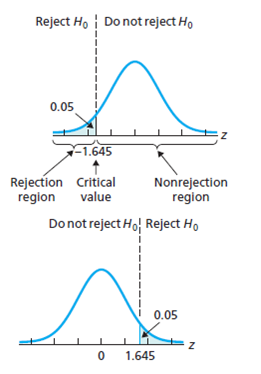
Exercises contain graphs portraying the decision criterion for a one-mean z-test. The curve in each graph is the normal curve for the test statistic under the assumption that the null hypothesis is true. For each exercise, determine the
A .Rejection region.
b. Nonrejection region.
c. critical value(s).
Significance level.
e. Construct a graph similar to that in Fig on page 378 that depicts your results from parts (a) ? (d).
f. Identify the hypothesis test as two tailed, left tailed, or right tailed.
FiGURE Rejection region, nonrejection region, and critical value for the golf-driving-distances hypothesis test
Expert Answer:
The following graph is given a The rejection region for the above graph is the set o... View the full answer

Related Book For 

Posted Date:
