

Question: From the below data answer the following questions: 1. What is the probability for: a. Randomly selecting a person being a male in Grade E?
From the below data answer the following questions:
1. What is the probability for:
a. Randomly selecting a person being a male in Grade E?
b. Given that we picked a random person and he was a male, what is the probability of being in grade E?
c. Why the results different?
2. Consider each group (Male and Female separately) and assume the salaries follow a Normal Probability distribution:
a. What is the top 75th percentile of salary for Males?
b. What is the top 75th percentile of salary for Females?
c. What is the probability that a male picked at random makes more than 50K?
d. What is the probability that a female picked at random makes between 30K and 40K?
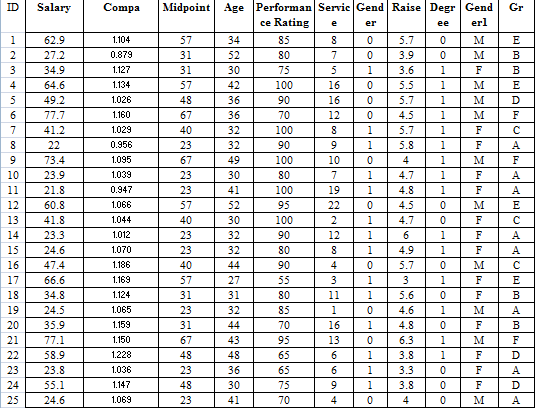
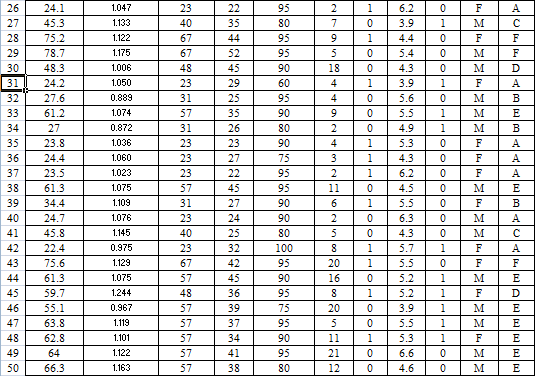
The column labels in the table mean:
ID ? Employee sample number
Salary ? Salary in thousands
Age ? Age in years
Performance Rating - Appraisal rating (employee evaluation score)
Service ? Years of service (rounded)
Gender ? 0 = male, 1 = female
Midpoint ? salary grade midpoint
Raise ? percent of last raise
Grade ? job/pay grade
Degree (0= BSBA 1 = MS)
Gender1 (Male or Female)
Compa - salary divided by midpoint
ID 123456 Salary 62.9 27.2 34.9 64.6 49.2 77.7 41.2 22 7 8 9 10 11 12 13 14 15 16 17 18 19 24.5 20 35.9 21 77.1 22 58.9 23 23.8 24 55.1 25 24.6 73.4 23.9 21.8 60.8 41.8 23.3 24.6 47.4 66.6 34.8 Compa Midpoint Age Performan Servic Gend Raise Degr Gend Gr ce Rating e erl er ee 0 0 1.104 0.879 1.127 1.134 1.026 1.160 1.029 0.956 1.095 1.039 0.947 1.066 1.044 1.012 1.070 1.186 1.169 1.124 1.065 1.159 1.150 1.228 1.036 1.147 1.069 57 31 31 57 48 67 40 23 67 23 23 57 40 23 23 40 57 31 23 31 67 48 23 48 23 34 52 30 42 36 36 32 32 49 30 41 52 30 32 32 44 27 31 32 44 43 48 36 30 41 85 80 75 100 90 70 100 90 100 80 100 95 100 90 80 90 55 80 85 70 95 65 65 75 70 8 7 5 16 16 0 5.7 12 0 4.5 8 1 5.7 9 1 5.8 10 0 4 7 4.7 19 4.8 22 0 4.5 2 1 4.7 12 6 8 4.9 4 5.7 3 3 11 5.6 1 4.6 16 4.8 6.3 3.8 3.3 13 6 6 9 4 1 0 1 1 1 1 0 1 1 0 1 0 1 1 1 5.7 3.9 3.6 5.5 0 mier coli 3.8 4 oo. 0 0 1 1 1 1 1 1 1 F F M 1 F 1 F 0 M F F F 0 1 1 0 1 HOH M M F M M M 0 MARN 1 M 0 F 1 M 1 0 0 0 NAREN F M EBBEAR D F A F A A E A AUEBABKAAAA F D D 26 24.1 27 45.3 28 75.2 29 78.7 30 48.3 31 24.2 32 27.6 61.2 33 34 35 36 37 38 39 0 1 2 3 4 5 6 7 8 49 50 41 42 27 23.8 24.4 23.5 40 24.7 45.8 61.3 46 34.4 22.4 43 75.6 44 61.3 45 59.7 55.1 47 63.8 48 62.8 64 66.3 1.047 1.133 1.122 1.175 1.006 1.050 0.889 1.074 0.872 1.036 1.060 1.023 1.075 1.109 1.076 1.145 0.975 1.129 1.075 1.244 0.967 1.119 1.101 1.122 1.163 23 40 67 67 48 23 31 57 31 23 23 23 57 31 23 40 23 67 57 48 57 57 57 57 57 22 35 44 52 45 29 25 35 26 23 27 22 45 27 24 25 32 42 45 36 39 37 34 41 38 95 80 95 95 90 60 95 90 80 90 75 95 95 90 90 80 100 95 90 95 75 95 90 95 80 2 7 9 5 18 4 4 9 2 4 3 2 11 1 0 1 0 0 1 0 0 0 1 1 4.3 3.9 5.6 5.5 4.9 5.3 4.3 6.2 4.5 5.5 6.3 4.3 5.7 1 5.5 5.2 5.2 1 0 1 0 6 2 5 8 20 16 0 8 1 20 5 11 21 12 0 1 0 0 1 6.2 0 0 3.9 4.4 5.4 nipi 3.9 5.5 5.3 a ai 6.6 4.6 OHOOO 0 1 M 0 0 M 0 M 1 F 0 1 1 0 0 0 OOO 0 FNEN 0 1 0 1 1 1 MENER A A F A 0 M E 0 F BIBI M M F F M F M F M ACR 2 M F F AABEB D MAUARNANNNNN B F 1 M E 1 0 0 E D E E E E
Step by Step Solution
3.38 Rating (157 Votes )
There are 3 Steps involved in it
To solve the given problems well analyze the provided data Step 1 Calculate the probabilities a Probability of randomly selecting a male in Grade E 1 ... View full answer

Get step-by-step solutions from verified subject matter experts