

Suppose that you are working for a manufacturing company and want to visualize the types of defects
Question:
Suppose that you are working for a manufacturing company and want to visualize the types of defects that are occurring along with how many times each defect occurs. See the data below.
Defect Number of Defects
Misplaced transistors?????????..601
Wrong component??????????..212
Defective board dimension???????146
Components not adhering???????..143
Circuitry problems on final test?????...90
Excess adhesive???????????...71
Mounting holes improperly positioned??...12
a. Create a pie chart with an appropriate vertical axis, horizontal axis, and title. Copy and paste the chart into this document below. Below is an example of what your final chart should look like, although your titles and numbers will be different. Remove my example and insert your own.

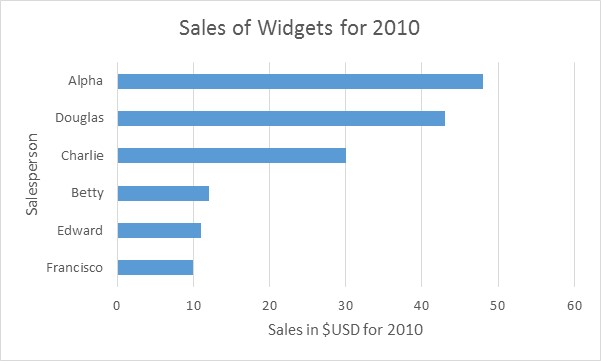
b. Create a bar chart with an appropriate vertical axis, horizontal axis, and title. Copy and paste the chart into this document below. Below is an example of what your final chart should look like, although your titles and numbers will be different. Remove my example and insert your own.
Expert Answer:


Systems Analysis and Design
ISBN: 978-1133274636
9th Edition
Authors: Shelly Cashman, Gary B. Shelly and Harry J. Rosenblatt
