

Table below shows number of people who work for the company, separated by age and gender, for
Fantastic news! We've Found the answer you've been seeking!
Question:
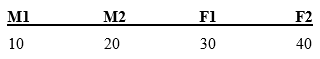
Table below shows number of people who work for the company, separated by age and gender, for M1,M2,F1,F2 use numbers assigned for you in the table below.

Based on data in your table find different probability:
1) That randomly selected person is Female and is less than 40 years old: P( Female and Below 40).
2) Probability that randomly selected person is Male or person is above 40 years old: P (Male or Above 40)
3) Find the probability that if selected person is female her age is below 40, conditional probability P(Below 40 if Female). In this case you should divide by number of Female in the table, not by total number of all people.
Expert Answer:

Related Book For 
Posted Date:
