

The following table shows a money demand schedule, which is the quantity of money demanded at various
Question:
The following table shows a money demand schedule, which is the quantity of money demanded at various price levels (p).
Fill in the values of money column in the following table.
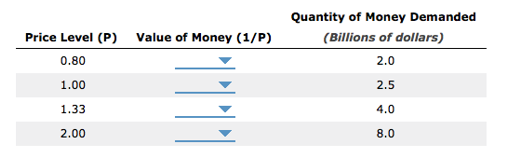
1) Now consider the relationship between the price level and the quantity of money that people demand. The lower the price level, the (more, less) money the typical transaction requires, and the (more, less) money people will wish to hold in the form of currency or demand deposits.
Assume that the fed initially fixes the quality of money supplied at $4 billion.
Use the orange line (square symbol) to plot the initial money supply (MS 1 ) set by the Fed. Then, referring to the previous table, use the blue connected points (Circle symbol) to graph the money demand curve.
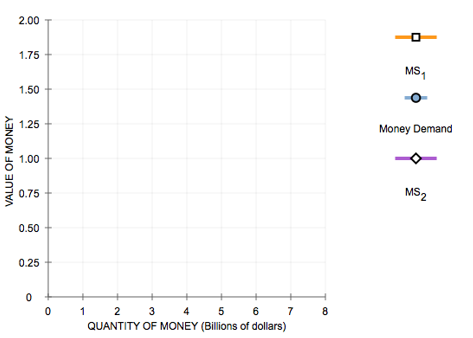
2) According to your graph, the equilibrium value of money is (.50, .75, 1, and 1.25) therefore the equilibrium price level is (.80, 1, 1.33, 2).
3) Now, suppose that the Fed reduces the money supply from the initial level of $4 billion to $2.5 billion.
In order to reduce the money supply, the Fed can use open-market operations to (sell bonds to, buy bonds from) the public.
Use the purple line (diamond symbol) to plot the new money supply ( ).
Expert Answer:
Fill the value of money column as follows 1 When the price level is lower a typical transaction requ... View the full answer


Quantitative Methods for Business
ISBN: 978-0324651751
11th Edition
Authors: David Anderson, Dennis Sweeney, Thomas Williams, Jeffrey cam
