

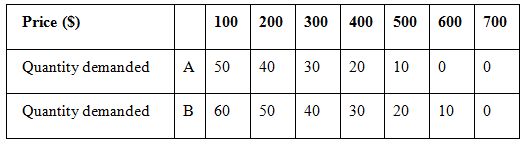
Question: Use the table below, which shows the demand for a public good in an economy consisting of two households, A and B, to answer the
Use the table below, which shows the demand for a public good in an economy consisting of two households, A and B, to answer the questions below.
Part A. What would make you doubt that the table is an accurate reporting of the individual demand curves?
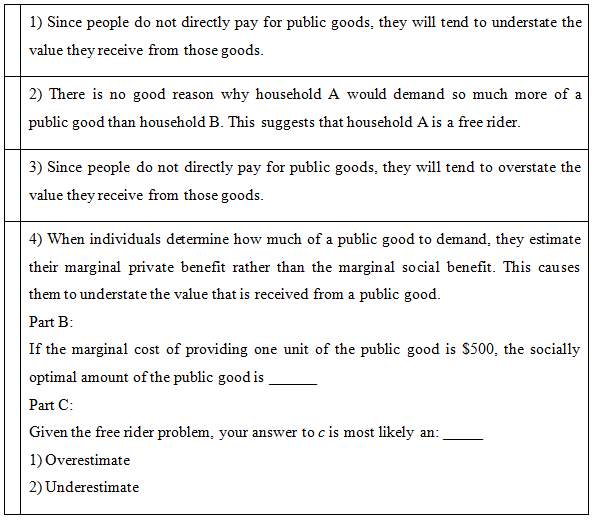
Price (S) Quantity demanded Quantity demanded 100 200 300 400 500 A 50 40 30 20 10 0 0 B 60 50 600 700 40 30 20 10 0 1) Since people do not directly pay for public goods, they will tend to understate the value they receive from those goods. 2) There is no good reason why household A would demand so much more of a public good than household B. This suggests that household A is a free rider. 3) Since people do not directly pay for public goods, they will tend to overstate the value they receive from those goods. 4) When individuals determine how much of a public good to demand, they estimate their marginal private benefit rather than the marginal social benefit. This causes them to understate the value that is received from a public good. Part B: If the marginal cost of providing one unit of the public good is $500, the socially optimal amount of the public good is Part C: Given the free rider problem, your answer to c is most likely an: 1) Overestimate 2) Underestimate
Step by Step Solution
3.52 Rating (155 Votes )
There are 3 Steps involved in it
Part A Doubts About the Tables Accuracy 1 Understatement of Value Public goods often suffer from the ... View full answer

Get step-by-step solutions from verified subject matter experts