

Question: Using the table below, which shows the demand for a public good in an economy consisting of two households, A and B, answer the following
Using the table below, which shows the demand for a public good in an economy consisting of two households, A and B, answer the following questions:
a. Graph the individual demand curves and the market demand curve.
b. What would make you doubt that the table is an accurate reporting of the individual demand curves?
c. If the marginal cost of providing one unit of the good is $2.00, what is the socially optimal amount of the public good?
d. Given the free rider problem, is your answer to c most likely an underestimate or an overestimate?
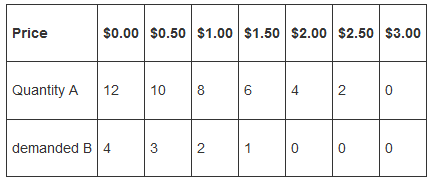
Price $0.00 $0.50 $1.00 $1.50 $2.00 $2.50 $3.00 Quantity A 12 demanded B 4 10 8 3 2 6 1 4 0 2 0 0 0
Step by Step Solution
3.41 Rating (157 Votes )
There are 3 Steps involved in it
To answer the questions well address each part step by step a Graph the individual demand curves and the market demand curve Demand Curves Table House... View full answer

Get step-by-step solutions from verified subject matter experts