

Question: Using the data provided in the accompanying table, fill in the last column and then provide answers to the following: 1. Identify whether the number
Using the data provided in the accompanying table, fill in the last column and then provide answers to the following:
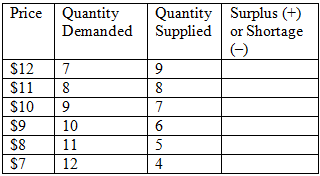
1. Identify whether the number is a surplus, shortage, or neither.
2. What is the efficient quantity?
3. What price results in the efficient quantity? Using the data from the table, draw graphs of a demand and supply curve and indicate the point of equilibrium with the help of the Grapher tool. Press the Alt+ Print Scrn keys simultaneously. Open a Microsoft Word document and insert the image by pressing the Ctrl+ V.
Price Quantity Demanded $12 $11 $10 $9 $8 $7 7 8 9 10 11 12 Quantity Supplied 987654 5 Surplus (+) or Shortage (-)
Step by Step Solution
3.52 Rating (162 Votes )
There are 3 Steps involved in it
To complete the table and answer the questions lets go through each row and calculate the surplus or ... View full answer

Get step-by-step solutions from verified subject matter experts