

Question: Historicals Projections SEKmm 2022 2023 2024 2025 2026 2027 2028 ROAE 50,5% 18,4% 37,2% 17,5% 16, 1% 15,3% ROAA 0,81% 0,57% 0,60% 0,57% 0,53% 0,50%
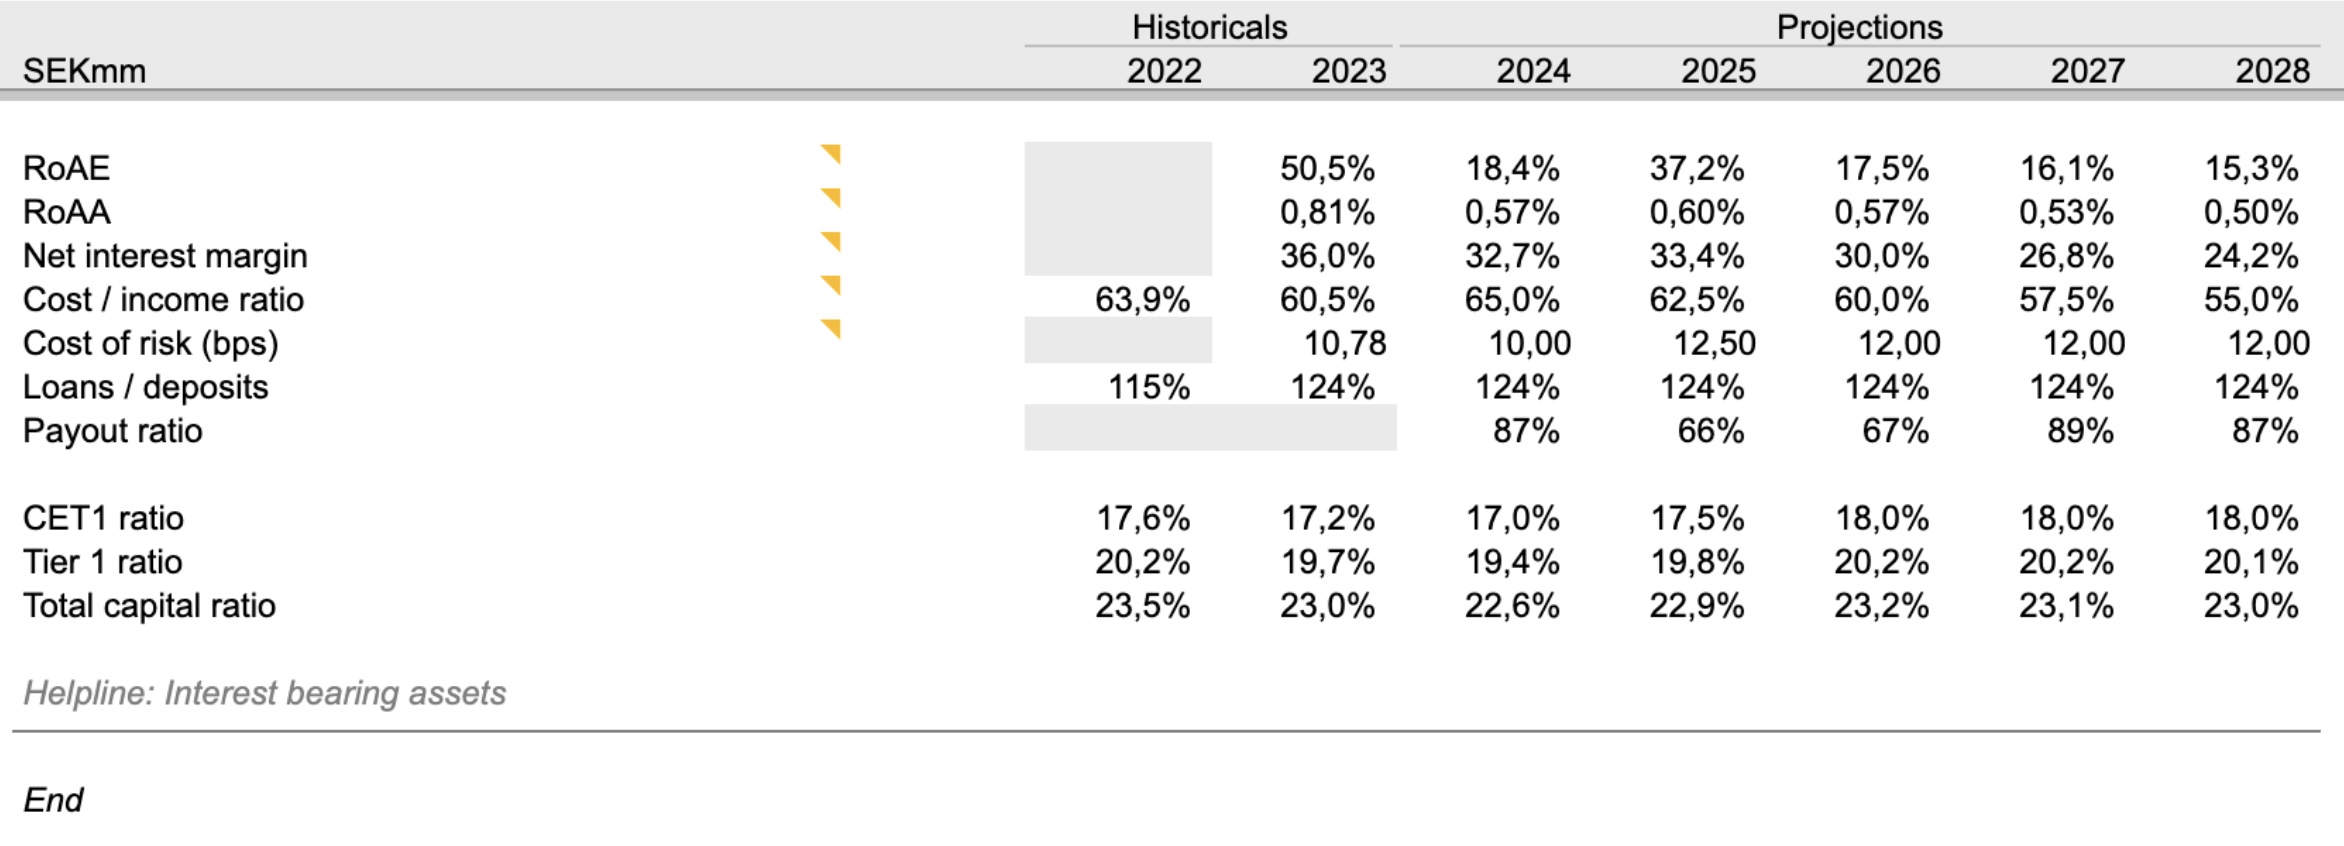
Historicals Projections SEKmm 2022 2023 2024 2025 2026 2027 2028 ROAE 50,5% 18,4% 37,2% 17,5% 16, 1% 15,3% ROAA 0,81% 0,57% 0,60% 0,57% 0,53% 0,50% Net interest margin 36,0% 32,7% 33,4% 30,0% 26,8% 24,2% Cost / income ratio 63,9% 60,5% 65,0% 62,5% 60,0% 57,5% 55,0% Cost of risk (bps) 10,78 10,00 12,50 12,00 12,00 12,00 Loans / deposits 115% 124% 124% 124% 124% 124% 124% Payout ratio 87% 66% 67% 89% 87% CET1 ratio 17,6% 17,2% 17,0% 17,5% 18,0% 18,0% 18,0% Tier 1 ratio 20,2% 19,7% 19,4% 19,8% 20,2% 20,2% 20, 1% Total capital ratio 23,5% 23,0% 22,6% 22,9% 23,2% 23, 1% 23,0% Helpline: Interest bearing assets End
Step by Step Solution
There are 3 Steps involved in it
1 Expert Approved Answer
Step: 1 Unlock

Question Has Been Solved by an Expert!
Get step-by-step solutions from verified subject matter experts
Step: 2 Unlock
Step: 3 Unlock