

Question: EXHIBIT 4.10 Starbucks-Year 1 Free Cash Flow Schedule Forecasts pg. 173 STARBUCKS CORPORATION Free Cash Fl (for the fiscal years ended October) ($ in thousands)
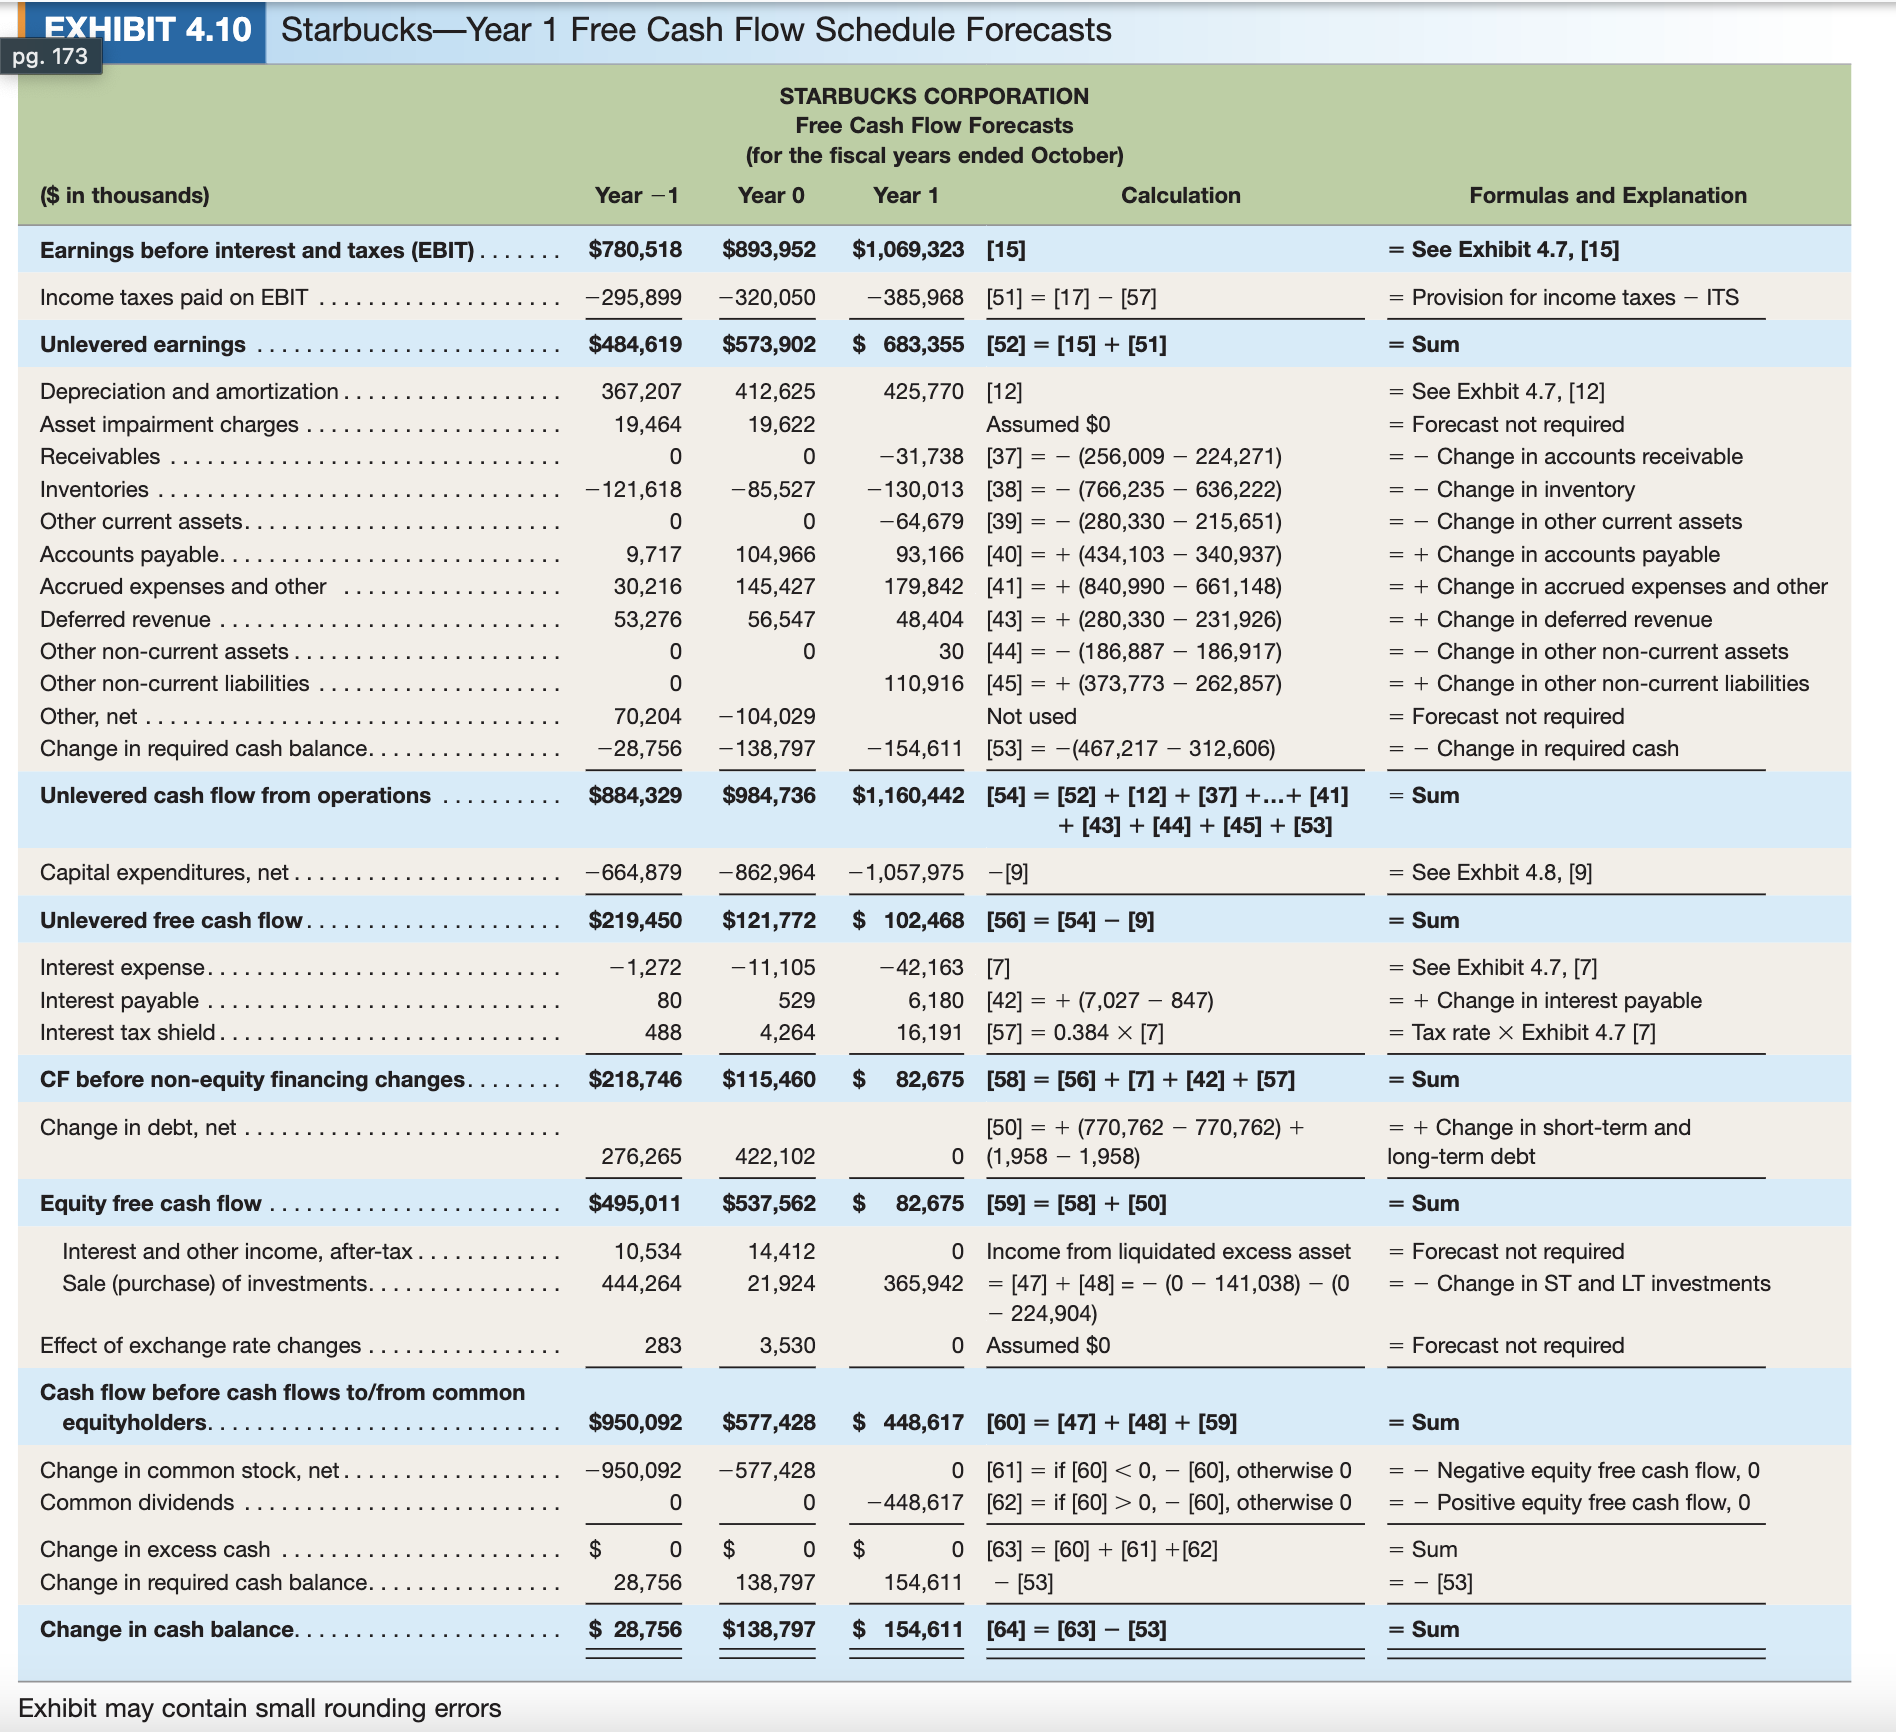
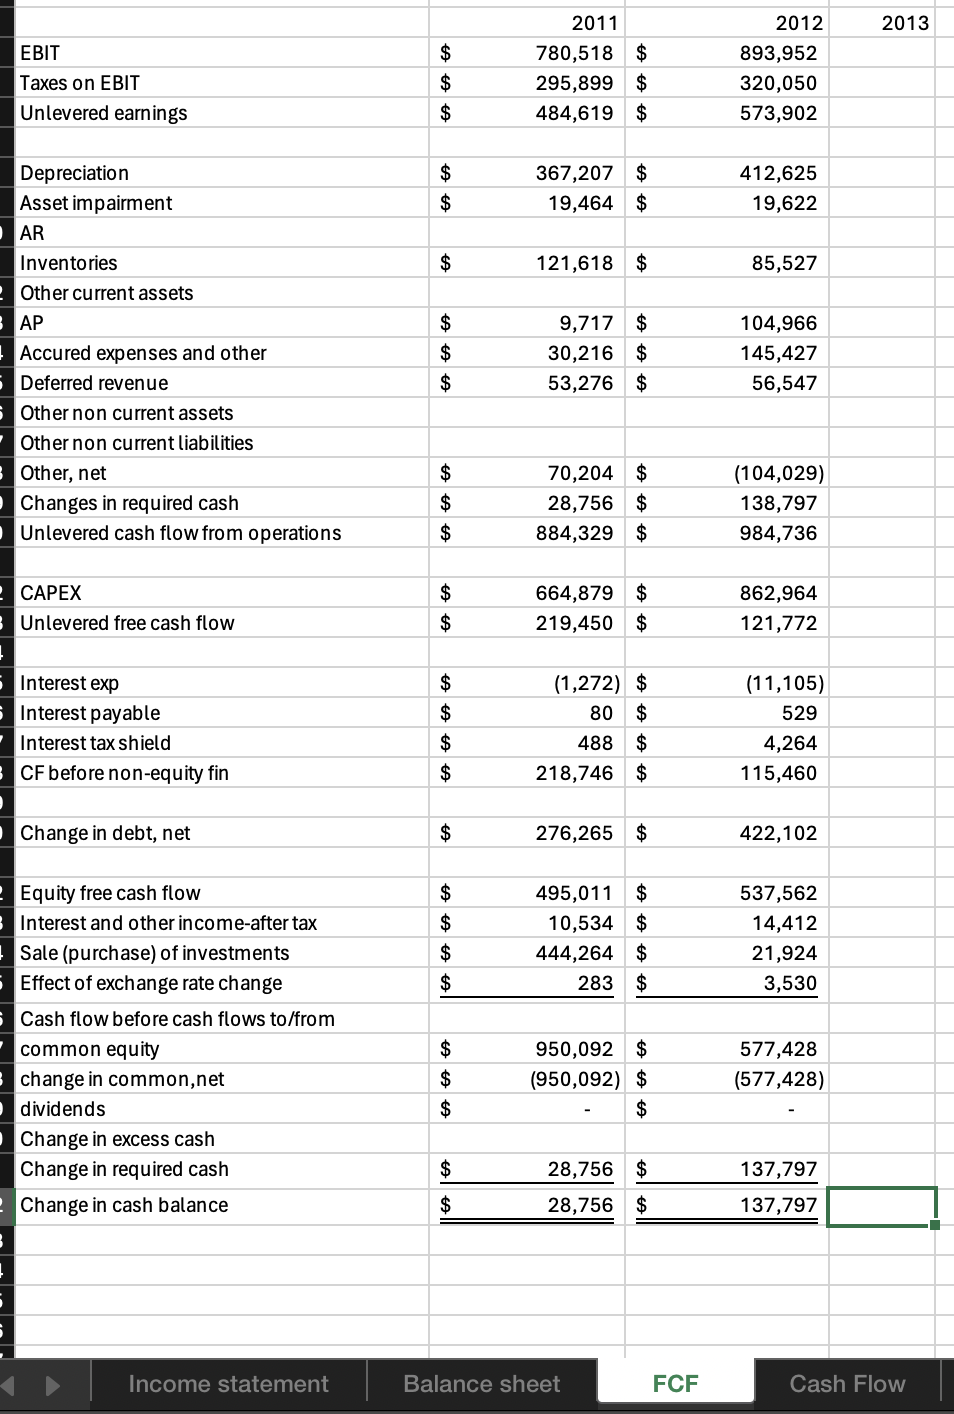
EXHIBIT 4.10 Starbucks-Year 1 Free Cash Flow Schedule Forecasts pg. 173 STARBUCKS CORPORATION Free Cash Fl (for the fiscal years ended October) ($ in thousands) Year -1 Year 0 Year Calculation Formulas and Explanation Earnings before interest and taxes (EBIT) . . . . . . . $780,518 $893,952 $1,069,323 [15] = See Exhibit 4.7, [15] Income taxes paid on EBIT . . . 295,89 320,050 385,968 [51] = [17] - [57] = Provision for income taxes - ITS Unlevered earnings . $484,619 $573,902 $ 683,355 [52] = [15] + [51] = Sum Depreciation and amortization . . . . . . . 367,207 412,625 425,770 [12] = See Exhbit 4.7, [12] Asset impairment charges . 19,464 19,622 Assumed $0 = Forecast not required Receivables . -31,738 [37] = - (256,009 - 224,271) = - Change in accounts receivable Inventories . . . . . . . . . . . . . . -121,618 85,527 -130,013 [38] = - (766,235 - 636,222) - Change in inventory Other current assets. . . . . -64,679 [39] = - (280,330 - 215,651) = - Change in other current assets Accounts payable. 9,717 104,966 93,166 [40] = + (434,103 - 340,937) = + Change in accounts payable Accrued expenses and other 30,216 145,427 179,842 [41] = + (840,990 - 661,148) = + Change in accrued expenses and other Deferred revenue . .. 53,276 56,547 48,404 [43] = + (280,330 - 231,926) = + Change in deferred revenue Other non-current assets . . 30 [44] = - (186,887 - 186,917) Change in other non-current assets Other non-current liabilities . 0 110,916 [45] = + (373,773 - 262,857) = + Change in other non-current liabilities Other, net . 70,204 -104,029 Not used = Forecast not required Change in required cash balance. . .. 28,756 -138,797 -154,611 [53] = -(467,217 - 312,606 Change in required cash Unlevered cash flow from operations . . . . . . . . . . $884,329 $984,736 $1,160,442 [54] = [52] + [12] + [37] +...+ [41] = Sum + [43] + [44] + [45] + [53] Capital expenditures, net . . . . . . . . . . . . . . . . 664,879 -862,964 1,057,975 [9] See Exhbit 4.8, [9] Unlevered free cash flow . . . . . . . $219,450 $121,772 $ 102,468 [56] = [54] - [9] = Sum Interest expense. . . . . . . -1,272 11, 105 42,163 [7] = See Exhibit 4.7, [7] Interest payable . . .. 80 529 6,180 [42] = + (7,027 - 847) = + Change in interest payable Interest tax shield . 188 4,264 16,191 [57] = 0.384 X [7] = Tax rate X Exhibit 4.7 [7] CF before non-equity financing changes. . . . . . .. $218,746 $115,460 $ 82,675 [58] = [56] + [7] + [42] + [57] = Sum Change in debt, net . . . . . . . . . . . . . . [50] = + (770,762 - 770,762) + = + Change in short-term and 276,265 422,102 0 (1,958 - 1,958) long-term debt Equity free cash flow . ... $495,011 $537,562 $ 82,675 [59] = [58] + [50] = Sum Interest and other income, after-tax . . 10,534 14,412 Income from liquidated excess asset = Forecast not required Sale (purchase) of investments. . . . . . . . . . 444,264 21,924 365,942 = [47] + [48] = - (0 - 141,038) - (0 - Change in ST and LT investments - 224,904) Effect of exchange rate changes . . ... . . . . . . . 283 3,530 0 Assumed $0 = Forecast not required Cash flow before cash flows to/from common equityholders. . . . . . . . . . . $950,092 $577,428 $ 448,617 [60] = [47] + [48] + [59] = Sum Change in common stock, net. 950,092 577,428 0 [61] = if [60] 0, - [60], otherwise 0 - Positive equity free cash flow, 0 Change in excess cash . . . . . $ 0 $ 0 $ [63] = [60] + [61] +[62] = Sum Change in required cash balance. . . . . . 28,756 138,797 154,611 - [53] - [53] Change in cash balance. . . . . . . . . . . . . . $ 28,756 $138,797 $ 154,611 [64] = [63] - [53 = Sum Exhibit may contain small rounding errors2011 2012 2013 EBIT 780,518 $ 893,952 Taxes on EBIT 295,899 $ 320,050 Unlevered earnings 484,619 $ 573,902 Depreciation 367,207 $ 412,625 Asset impairment 19,464 $ 19,622 AR Inventories 121,618 $ 85,527 Other current assets AP 9,717 $ 104,966 Accured expenses and other 30,216 $ 145,427 Deferred revenue 53,276 $ 56,547 Other non current assets Other non current liabilities Other, net 70,204 $ (104,029) Changes in required cash 28,756 138,797 Unlevered cash flow from operations 884,329 984,736 CAPEX 664,879 $ 862,964 Unlevered free cash flow 219,450 $ 121,772 Interest exp (1,272) $ (11, 105) Interest payable 80 $ 529 Interest tax shield 488 $ 4,264 CF before non-equity fin 218,746 $ 115,460 Change in debt, net 276,265 $ 422, 102 Equity free cash flow 495,011 $ 537,562 Interest and other income-after tax 10,534 14,412 Sale (purchase) of investments 444,264 $ 21,924 Effect of exchange rate change 283 $ 3,530 Cash flow before cash flows to/from common equity 950,092 $ 577,428 change in common, net (950,092) $ (577,428) dividends $ Change in excess cash Change in required cash 28,756 137,797 Change in cash balance 28,756 137,797 Income statement Balance sheet FCF Cash Flow
Step by Step Solution
There are 3 Steps involved in it

Get step-by-step solutions from verified subject matter experts