

Question: Consider the following graph of post earnings announcement drift. Cumulative abnormal return (%) 10.00 8.00 6.00 4.00 2.00 0 A -2.00 -4.00 3 -6.00 2
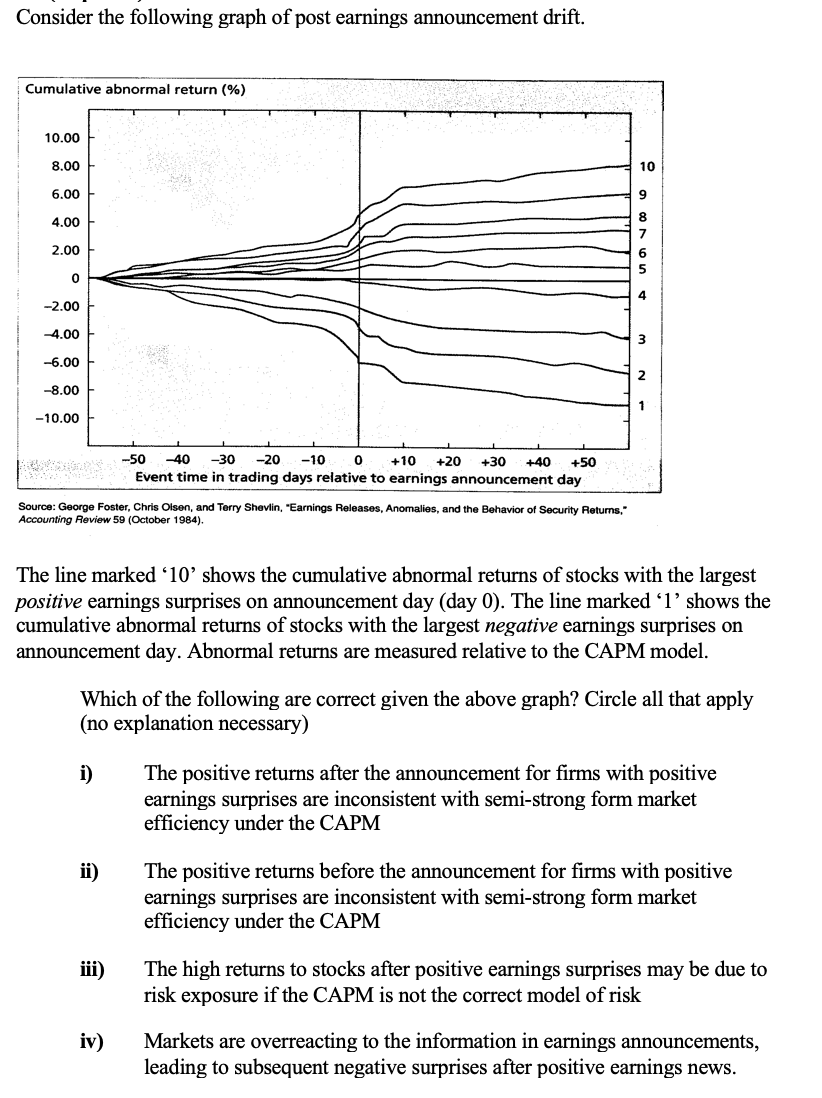
Consider the following graph of post earnings announcement drift. Cumulative abnormal return (%) 10.00 8.00 6.00 4.00 2.00 0 A -2.00 -4.00 3 -6.00 2 -8.00 -10.00 0 -40 -30 -20 -10 0 +10 +20 +30 :+40 +50 Event time in trading days relative to earnings announcement day Source: George Foster, Chris Olsen, and Terry Shevlin, "Earnings Releases, Anomalies, and the Behavior of Security Returns," Accounting Review 59 (October 1984). The line marked '10' shows the cumulative abnormal returns of stocks with the largest positive earnings surprises on announcement day (day 0). The line marked '1' shows the cumulative abnormal returns of stocks with the largest negative earnings surprises on announcement day. Abnormal returns are measured relative to the CAPM model. Which of the following are correct given the above graph? Circle all that apply (no explanation necessary) i) The positive returns after the announcement for firms with positive earnings surprises are inconsistent with semi-strong form market efficiency under the CAPM ii) The positive returns before the announcement for firms with positive earnings surprises are inconsistent with semi-strong form market efficiency under the CAPM iii) The high returns to stocks after positive earnings surprises may be due to risk exposure if the CAPM is not the correct model of risk iv) Markets are overreacting to the information in earnings announcements, leading to subsequent negative surprises after positive earnings news
Step by Step Solution
There are 3 Steps involved in it

Get step-by-step solutions from verified subject matter experts