

Question: Quinton Stromme 2021-Fall-STAT-212-PULLM-1-01-01971-Intro to Stat Methods Question 12, 2.2.25-T HW Score: 72.89%, 10.93 of 15 points Homeworl Save Part 1 of 8 O Points: 0
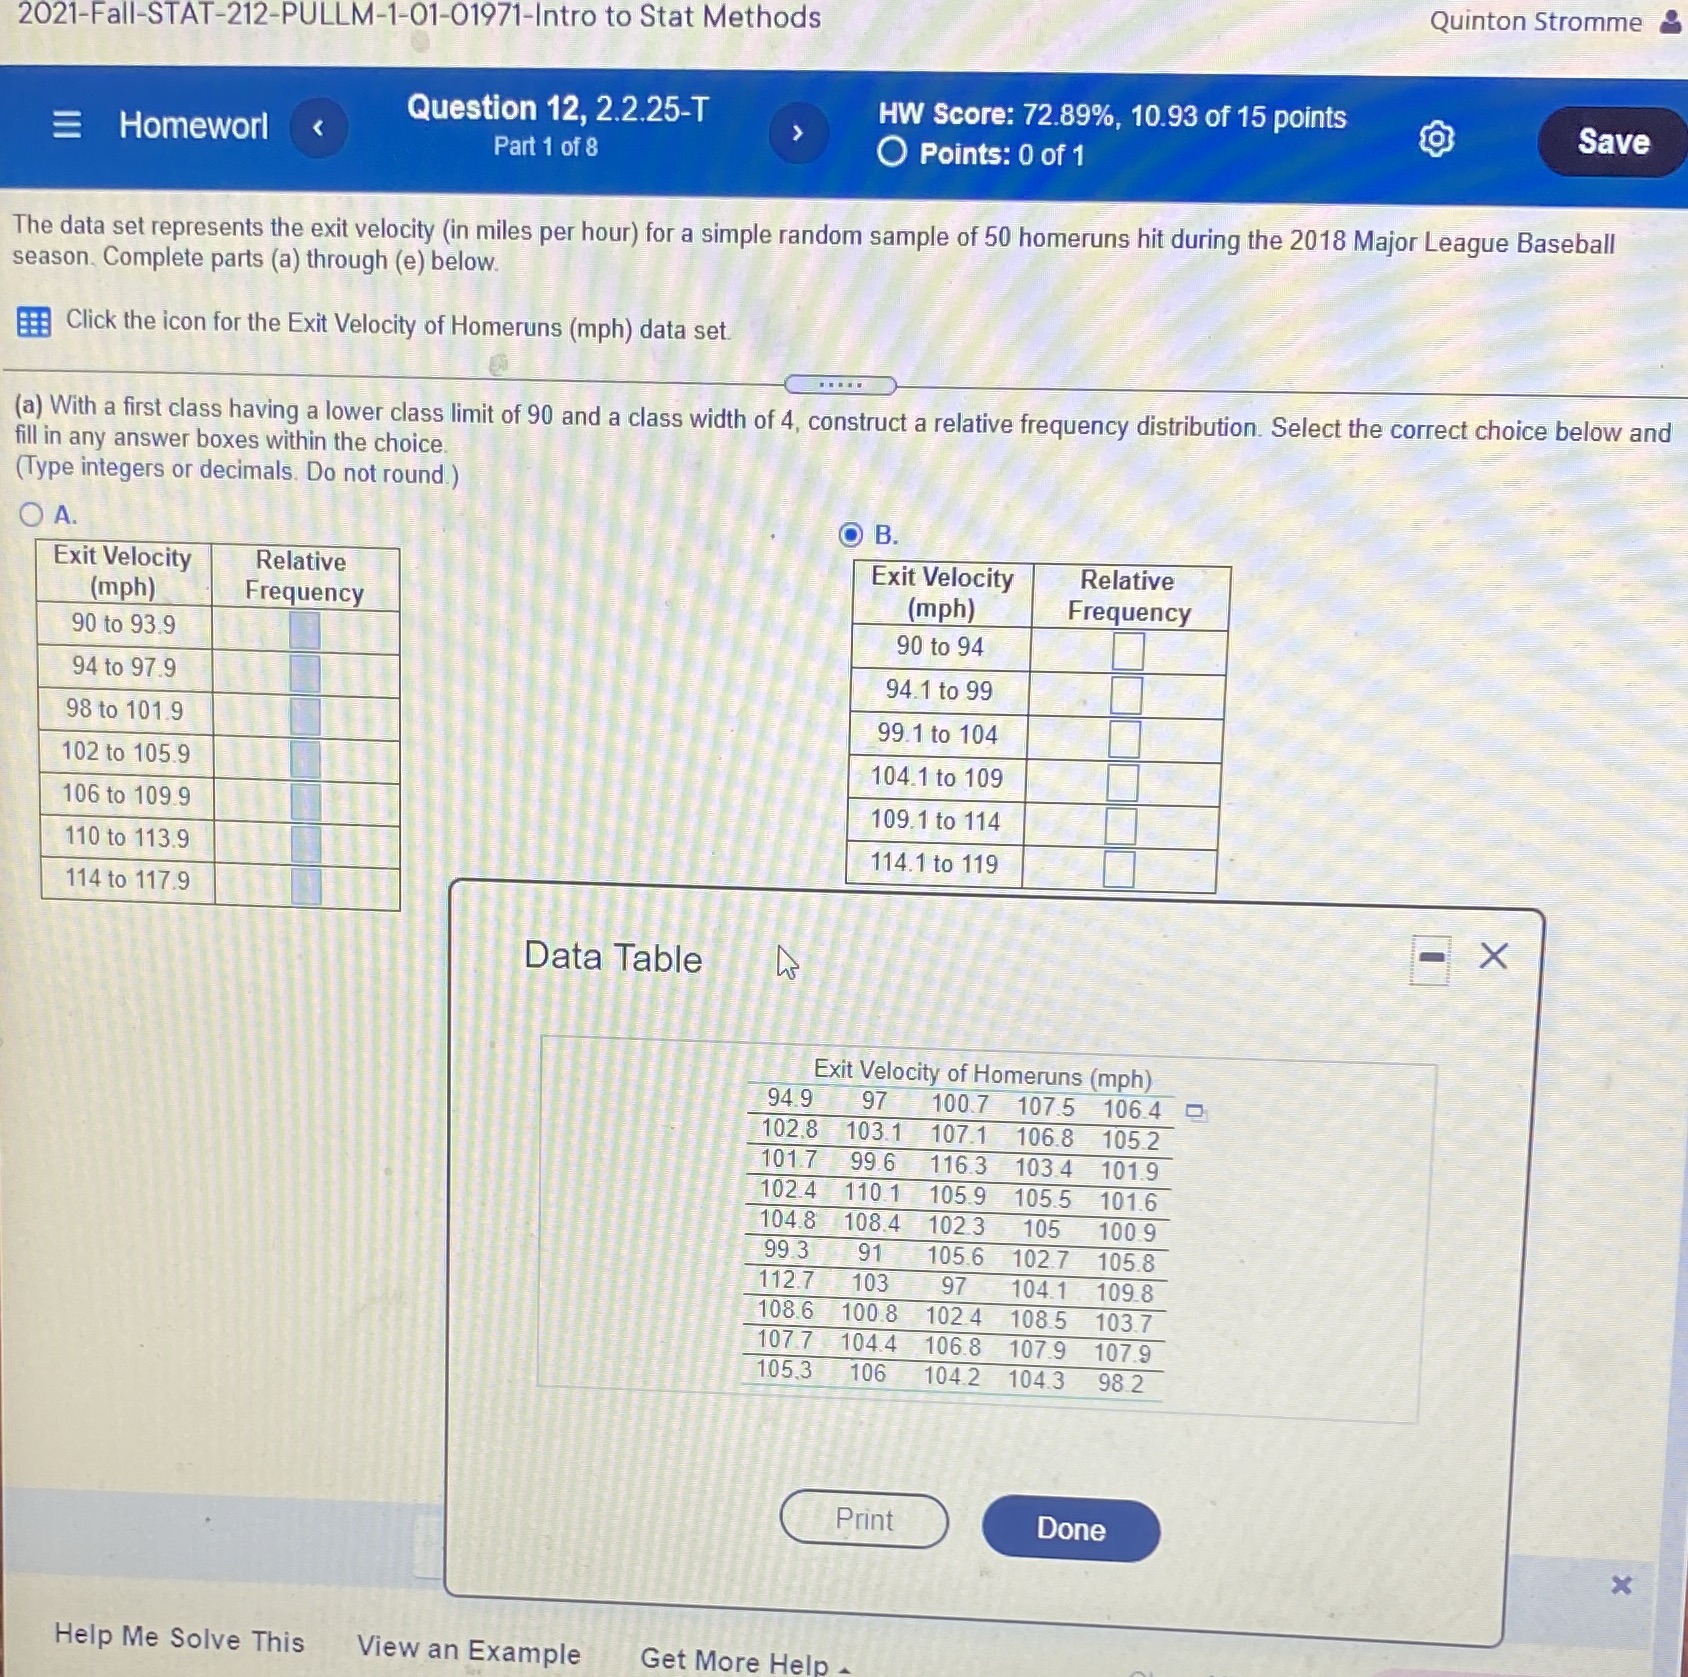
Quinton Stromme 2021-Fall-STAT-212-PULLM-1-01-01971-Intro to Stat Methods Question 12, 2.2.25-T HW Score: 72.89%, 10.93 of 15 points Homeworl Save Part 1 of 8 O Points: 0 of 1 The data set represents the exit velocity (in miles per hour) for a simple random sample of 50 homeruns hit during the 2018 Major League Baseball season. Complete parts (a) through (e) below. Click the icon for the Exit Velocity of Homeruns (mph) data set (a) With a first class having a lower class limit of 90 and a class width of 4, construct a relative frequency distribution. Select the correct choice below and fill in any answer boxes within the choice. (Type integers or decimals. Do not round.) O A. OB. Exit Velocity Relative Exit Velocity Relative (mph) Frequency (mph) Frequency 90 to 93.9 90 to 94 94 to 97.9 94. 1 to 99 98 to 101.9 99 1 to 104 102 to 105.9 104.1 to 109 106 to 109.9 109.1 to 114 110 to 113.9 114.1 to 119 114 to 117.9 X Data Table Exit Velocity of Homeruns (mph) 94.9 97 100.7 107.5 1064 102.8 103.1 107.1 106.8 105.2 1017 99.6 1163 103 4 101.9 102 4 110 1 105.9 105.5 101.6 104.8 108.4 102.3 105 100 9 99.3 91 105.6 102.7 105.8 112.7 103 97 104.1 109.8 108.6 100.8 102 4 108 5 103.7 107 7 104.4 106.8 107.9 107.9 105.3 106 104.2 104.3 9 Print Done X Help Me Solve This View an Example Get More Help
Step by Step Solution
There are 3 Steps involved in it
The detailed ... View full answer

Get step-by-step solutions from verified subject matter experts