

Question: 0 3 / The information below is from the rain gauges' own log during one of the rain events. table [ [ 9 0
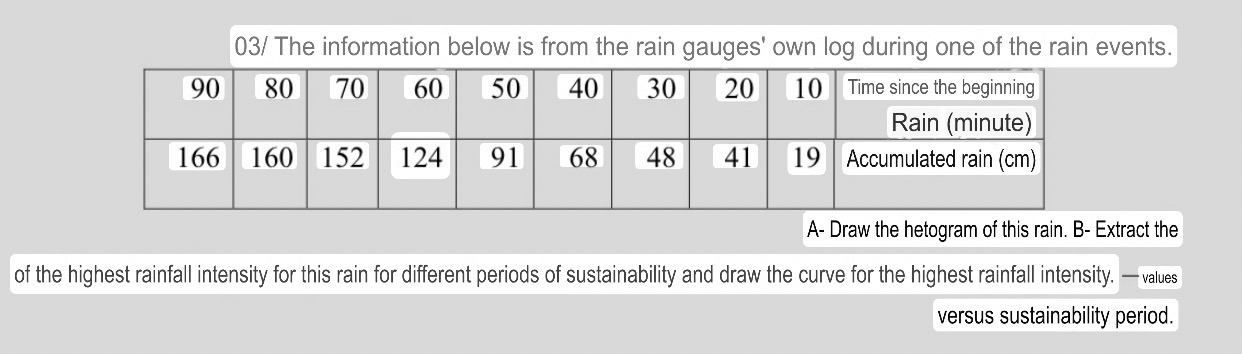
The information below is from the rain gauges' own log during one of the rain events.
tabletableTime since the beginningRain minuteAccumulated rain cm
A Draw the hetogram of this rain. B Extract the of the highest rainfall intensity for this rain for different periods of sustainability and draw the curve for the highest rainfall intensity. versus sustainability period.
Step by Step Solution
There are 3 Steps involved in it
1 Expert Approved Answer
Step: 1 Unlock

Question Has Been Solved by an Expert!
Get step-by-step solutions from verified subject matter experts
Step: 2 Unlock
Step: 3 Unlock