

Question: 0 File Edit Tools Help Announcements Question 19 1.5 pts Zoom New Mode . Delay - H S - / - . . Modules USE

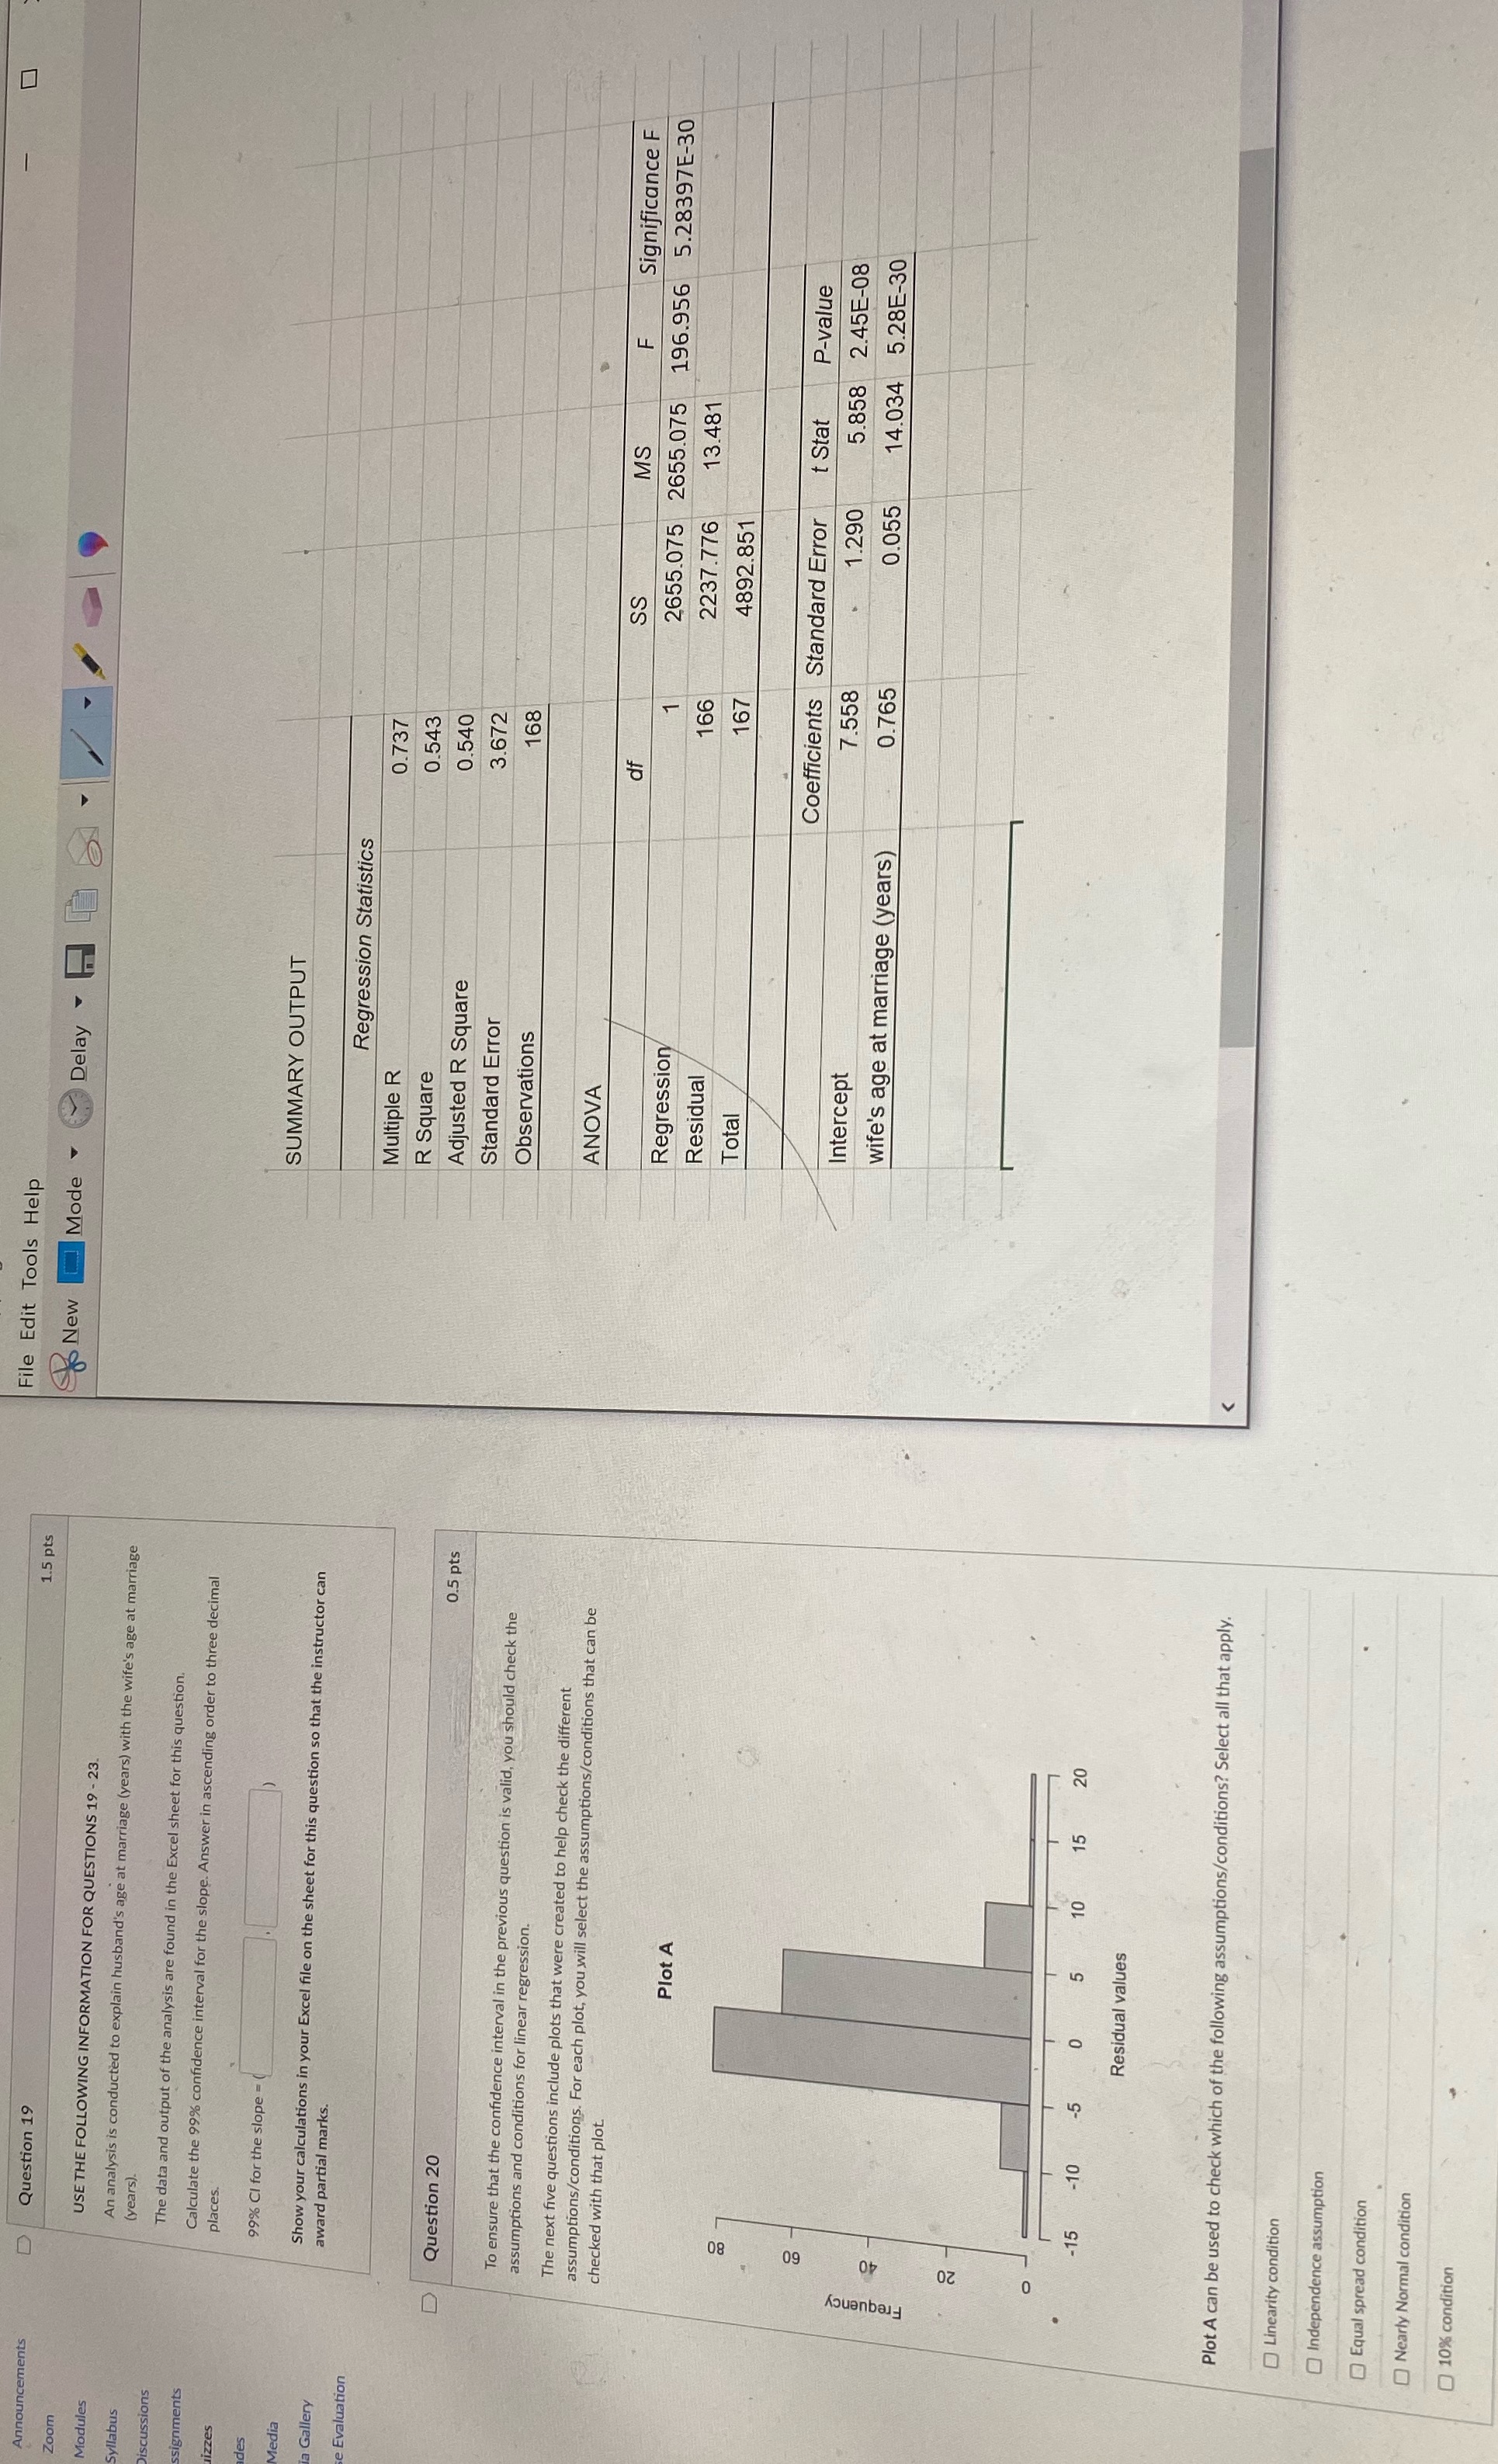
0 File Edit Tools Help Announcements Question 19 1.5 pts Zoom New Mode . Delay - H S - / - . . Modules USE THE FOLLOWING INFORMATION FOR QUESTIONS 19 - 23. Syllabus An analysis is conducted to explain husband's age at marriage (years) with the wife's age at marriage (years). Discussions The data and output of the analysis are found in the Excel sheet for this question. signments Calculate the 99% confidence interval for the slope. Answer in ascending order to three decimal izzes places. des 99% Cl for the slope = ( SUMMARY OUTPUT Media Gallery Show your calculations in your Excel file on the sheet for this question so that the instructor can award partial marks. Regression Statistics Evaluation Multiple R 0.737 R Square 0.543 Question 20 0.5 pts Adjusted R Square 0.540 Standard Error 3.672 To ensure that the confidence interval in the previous question is valid, you should check the Observations 168 assumptions and conditions for linear regression. The next five questions include plots that were created to help check the different assumptions/conditions. For each plot, you will select the assumptions/conditions that can be ANOVA checked with that plot MS LL Significance F Regression 2655.075 2655.075 196.956 5.28397E-30 Plot A Residual 166 2237.776 13.481 Tota 167 4892.851 Coefficients Standard Error t Stat P-value 09 Intercept 7.558 1.290 5.858 2.45E-08 wife's age at marriage (years) 0.765 0.055 14.034 5.28E-30 Frequency 20 -15 -10 -5 0 5 10 15 20 Residual values Plot A can be used to check which of the following assumptions/conditions? Select all that apply. Linearity condition Independence assumption Equal spread condition Nearly Normal condition 10% condition
Step by Step Solution
There are 3 Steps involved in it

Get step-by-step solutions from verified subject matter experts