

Question: 0 . For the data in the table below a. Calculate the centerlines, and limits for an average and range plot. b. Plot the lines
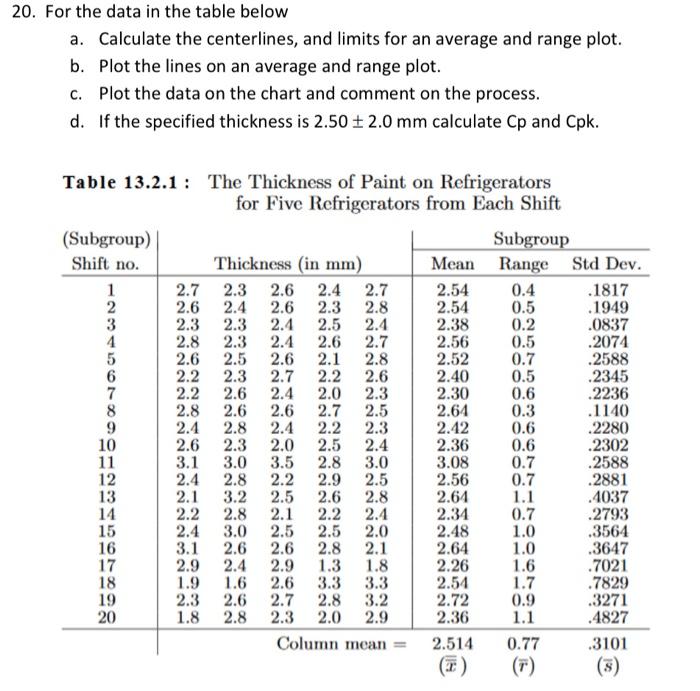
0 . For the data in the table below a. Calculate the centerlines, and limits for an average and range plot. b. Plot the lines on an average and range plot. c. Plot the data on the chart and comment on the process. d. If the specified thickness is 2.502.0mm calculate Cp and Cpk. Table 13.2.1: The Thickness of Paint on Refrigerators for Five Refrigerators from Each Shift
Step by Step Solution
There are 3 Steps involved in it
1 Expert Approved Answer
Step: 1 Unlock

Question Has Been Solved by an Expert!
Get step-by-step solutions from verified subject matter experts
Step: 2 Unlock
Step: 3 Unlock