

Question: please answer correctly in full with calculations and I will give good rating! thank you! Statistical Process Control Problem: You are the manager of a
please answer correctly in full with calculations and I will give good rating! thank you! 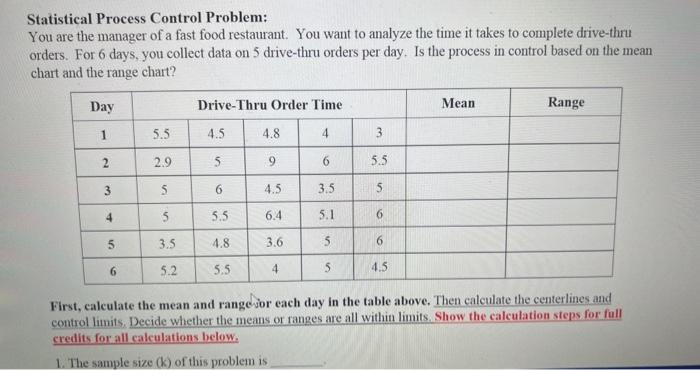
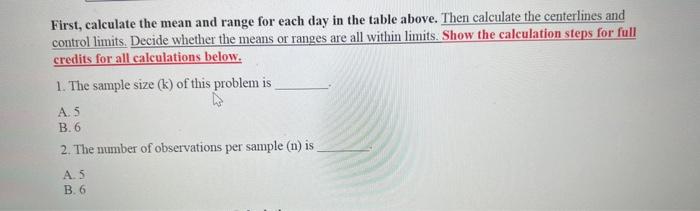
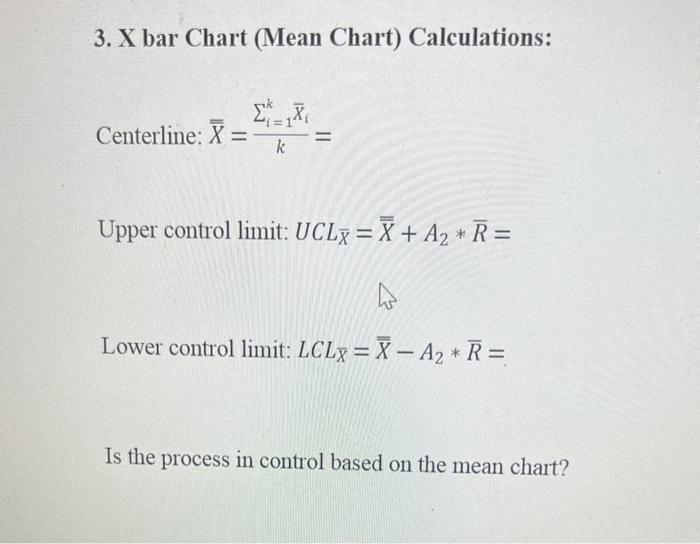
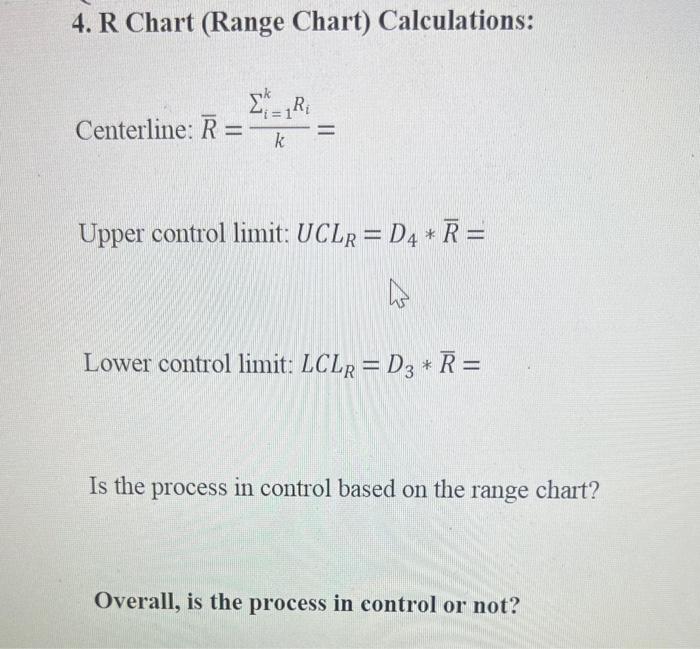
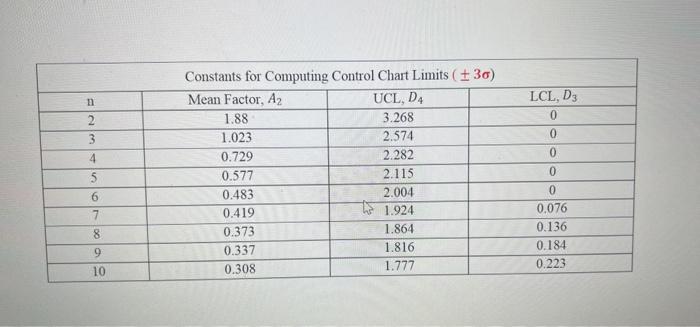
Statistical Process Control Problem: You are the manager of a fast food restaurant. You want to analyze the time it takes to complete drive-thru orders. For 6 days, you collect data on 5 drive-thru orders per day. Is the process in control based on the mean chart and the range chart? First, calculate the mean and rangevor each day in the table above. Then calculate the centerlines and control limits, Decide whether the means or ranges are all within limits. Show the calculation steps for full credits for all calculations helow. 1. The sample size (k) of this problem is First, calculate the mean and range for each day in the table above. Then calculate the centerlines and control limits. Decide whether the means or ranges are all within limits. Show the calculation steps for full credits for all calculations below. 1. The sample size (k) of this problem is A. 5 B. 6 2. The number of observations per sample (n) is A. 5 B. 6 3. X bar Chart (Mean Chart) Calculations: Centerline: X=ki=1kXi= Upper control limit: UCLX=X+A2R= Lower control limit: LCLX=XA2R= Is the process in control based on the mean chart? 4. R Chart (Range Chart) Calculations: Centerline: R=ki=1kRi= Upper control limit: UCLR=D4R= Lower control limit: LCLR=D3R= Is the process in control based on the range chart? Overall, is the process in control or not? \begin{tabular}{|c|c|c|c|} \hline \multicolumn{3}{|c|}{ Constants for Computing Control Chart Limits (3)} \\ \hline n & Mean Factor, A2 & UCL2 & LCL,D3 \\ \hline 2 & 1.88 & 3.268 & 0 \\ \hline 3 & 1.023 & 2.574 & 0 \\ \hline 4 & 0.729 & 2.282 & 0 \\ \hline 5 & 0.577 & 2.115 & 0 \\ \hline 6 & 0.483 & 2.004 & 0 \\ \hline 7 & 0.419 & 1.924 & 0.076 \\ \hline 8 & 0.373 & 1.864 & 0.136 \\ \hline 9 & 0.337 & 1.816 & 0.184 \\ \hline 10 & 0.308 & 1.777 & 0.223 \\ \hline \end{tabular} Step by Step Solution
There are 3 Steps involved in it
1 Expert Approved Answer
Step: 1 Unlock

Question Has Been Solved by an Expert!
Get step-by-step solutions from verified subject matter experts
Step: 2 Unlock
Step: 3 Unlock