

Question: 0 For the graphs below a What does each graph represent b Identify the independent and dependent variables c Write the domain and range for
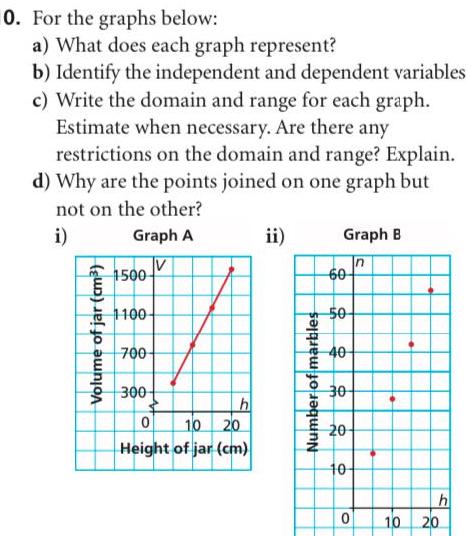

0 For the graphs below a What does each graph represent b Identify the independent and dependent variables c Write the domain and range for each graph Estimate when necessary Are there any restrictions on the domain and range Explain d Why are the points joined on one graph but not on the other i Graph A V Volume of jar cm 1500 1100 700 300 0 10 20 Height of jar cm h ii Number of marbles Graph B 60 50 40 30 20 10 0 10 h 20
Step by Step Solution
There are 3 Steps involved in it
1 Expert Approved Answer
Step: 1 Unlock

Question Has Been Solved by an Expert!
Get step-by-step solutions from verified subject matter experts
Step: 2 Unlock
Step: 3 Unlock